Statistics-Mathematics STD 4
Statistics is the branch of mathematics that deals with the stu dy of collecting, presenting and organizing data
Data are the information that are collected, presented and organized Ways of collecting and recording data.
(1) Using tally marks
(ii) Pictographs
 Pictorial bar graphs L Using tall marks Examples
Exercise
Japhet recorded the number of text books present in st. Colunba’s library as follows

Questions
How many books are there in the library?
How many more mathematics text books are there then kiswahili text books?
How many civics text books were recorded by Japhet?
Find the su of history and kiswahili text books in the library?
ii. Using pictographs
Pictographs means pictures graphs Example
Florarecorded the number of villagers in five villages as shown below


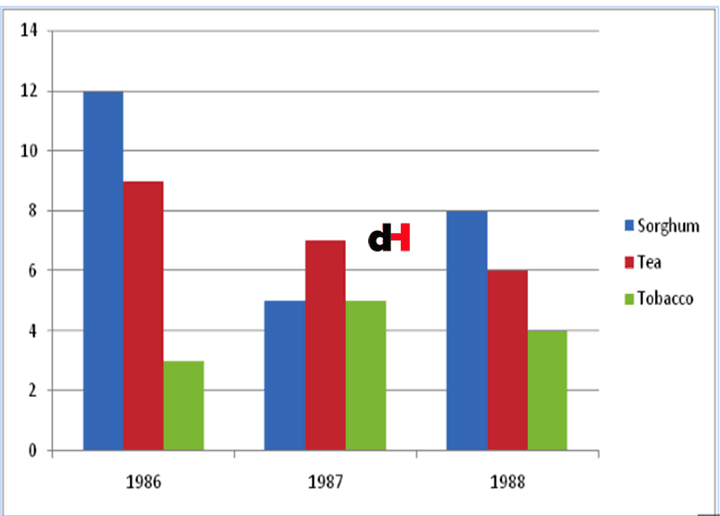
Examples III. Pictorial bar graphs
The following bar graph shows the numbers of pupils who a tended school in one week
 70
70
Questions
How many pupils attended on Friday?
Answer = 50
How many pupils attended on Thursday?
Answer =70
How many more pupils attended Tuesday than Wednesday?
Answer. 40 -30 = 10
How many pupils attended on Monday?
Answer = m20
Find the sum of pupils who attended on Tuesday on Friday?
Answer = 40 + 70 = 110
Exercise
Study the bar graph below which shows the marks scored by Martin in four subjects

- How many marks did Martin score in mathematics?
- In which subject did he score the least marks?
- In which subjects did he score? 50%
- What is the difference between marks scored in science and Kiswahili?