
Topic 6: Using Illustrations in Academic Communication – Academic Communication Notes Form Five
Effective communication goes beyond mere words. It depends on illustrations and other visual aids for conveying and clarifying complex ideas and enhancing understanding.
In this chapter you will learn how to identify, interpret and use illustrations such as graphs, maps, diagrams effectively in your academic undertakings. The competence developed in this chapter will enable you to make an effective interpretation of illustrations and effectively use them in academic documents.
Think
How one can use illustrations for effective communication.
Identifying simple and complex illustrations
Illustrations are visual representations meant to enhance reader’s comprehension or convey ideas. Illustrations in academic documents can be classified into two main categories namely: simple and complex illustrations.
Simple illustrations
They are typically used to convey straightforward concepts or ideas. These can include diagrams, charts, graphs, or simple line drawings. They are frequently used to enhance the text and present information directly and clearly. They can facilitate the reader’s understanding of the main ideas and are typically simple to understand.
Simple illustrations include line graphs, bar charts, pie charts, diagrams, flowcharts. Simple illustrations are characterised by the following features: they are clear and straightforward, they use minimal detail and they are easily recognizable shapes and patterns.
Simple illustrations in academic documents play the following roles:
Improve reader’s comprehension: They can help readers better understand complex information by presenting it in a more reachable and spontaneous format.
Summarize key points: When used correctly they can effectively sum up and highlight the main points from a text and in that way make it easier for readers to capture the essential points.
Facilitate analysis and interpretation: The use of graphs, charts, and diagrams can assist readers in interpreting and analysing data presented in other forms that
may be difficult to realise through text alone.
Enhance engagement: visual aids are also meant for creating visual appeal of a document. A well-designed simple illustration can make the academic document more visually appealing and engaging, which can improve the overall reading experience.

Complex Illustrations
These present more detailed or layered information. The are more detailed and complex visual representations involving a variety of elements such as multiple subjects, complex backgrounds, detailed quality, and detailed shading or colouring.
They often require a significant amount of time and skill to create due to their level of detail and the complexity of the elements involved, Complex illustrations can be of various forms, including digital art, traditional art, scientific illustrations, fantasy artwork, technical drawings, and more.
Specific complex illustrations include maps with multiple layers of data, info-graphics and technical drawings with complex details. Complex illustrations are characterised by richness in detail, multiple components and complexity that call for closer examination for full understanding.
Relating illustrations to the text
Illustrations such as graphs, tables, or pie charts can be drawn. Ideas from the information in the text provide a concrete connection between the illustration and the idea of the text.
Relating illustrations to the text allows the presenter to assess the audience’s understanding of the concept. Sometimes, illustrations and other visual aids convey information not found in the texts.
In these cases, the reader should treat the illustration separately. They can interpret the illustration as if there is no text related to the illustrations. Then, they can compare what they have interpreted with the information found in the text. This technique helps develop English for academic communication.
Importance of illustrations
Illustrations are crucial for displaying information and simplifying the interpretation of complex data. Generally, illustrations play the following roles;
(a) Enhancing understanding
All illustrations, including charts, graphs, maps, photographs, video stills, diagrams, and cartoons, can be effective when used to facilitate understanding.
(b) Visual appeal
When an assignment is first presented, the first thing a reader will notice is the visual layout. Most of the time, readers tend to assess the illustrations of the document before digging into the text and form early opinions based on how the information is set out.
(c) Conveying information efficiently
A simple illustration can transfer information more effectively than a large text. To present complex information for technical writing, for example, the author can use illustrations to serve the purpose of his document.
Exercise 6.2
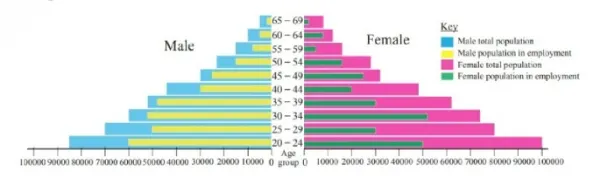
Interpret the following picture, then insert its caption and write a short description about it.

Preparing illustrations in academic documents
Being a student subjects you to a vigorous learning process. This process entails among others, preparation of various academic documents based on educational level, course requirements, and the subject.
Some common academic documents students are likely to prepare include: essays, research papers, theses, dissertations, reports, class presentations and annotated bibliographies. Preparation of academic documents can also involve preparing visual aids.
Some basic strategies to follow in preparing illustrations or visual aids in academic documents include the following:
(a) Identifying the purpose
A clear definition of the purpose of the visual document is important. Are you making a graph, chart, diagram, or any other illustration to support your objectives? Explain both simple and complex concepts or demonstrate a clear presentation of data. Understanding the purpose will guide your decisions throughout the preparation
process.
(b) Understanding the targeted audience
For visual aids to communicate the intended message, consider the audience viewing your document. Are they fellow students, researchers, or a broader audience?
Understanding your audience will help you choose the appropriate level of detail, terminology and visual style.
(c) Gathering and organising detailed information
Gather all the relevant information needed to be presented visually. Ensure that the information is accurate, up-to-date and properly cited. Organise the data logically to enhance clarity and understanding.
(d) Selecting an appropriate visual format
Select the most suitable visual format to present your information effectively. Common options include charts, flowcharts, line graphs, bar graphs, tables, diagrams, info-
graphics, maps and images. Think of the nature of your data and the information you want to communicate when making this decision.
(e) Designing the visual document
Good document design plays a vital role in preparing suitable visual documents for academic communication. It is crucial to pay attention to the design of elements to
ensure that your visual document is visually appealing and easy to comprehend.
For example, layout, colour scheme, font selection and overall aesthetics are essential,
and they have to be designed carefully. Therefore, consistency in designing elements throughout the document is highly observed.
(f) Creating the visual document
Use appropriate software tools for the type of visual documents you are creating. Common tools include spreadsheet software for charts and graphs, graphic design software for illustrations and info-graphics and presentation software for slide-based documents.
Activity 6.2
Use online/offline sources to study about graphic design software. Then, use the knowledge gained to create any illustration using that software.
Prepare a simple graph to present/summarise the following population fictional data.
| Year | Country A | Country B | Country C |
| 2019 | 50 | 60 | 70 |
| 2020 | 55 | 65 | 75 |
| 2021 | 60 | 70 | 80 |
| 2022 | 65 | 75 | 85 |
| 2023 | 70 | 80 | 90 |
Using illustrations in academic presentations
Illustrations in academic documents are useful in making complex ideas understandable by the reader. When an illustration is used in a document, it can prove to the audience the correctness of the arguments.
However, most writers lack essential skills to use illustrations and the technical criteria that make the illustrations good. Knowledge about preparation of illustrations helps a writer to prepare documents and analyse the work of others.
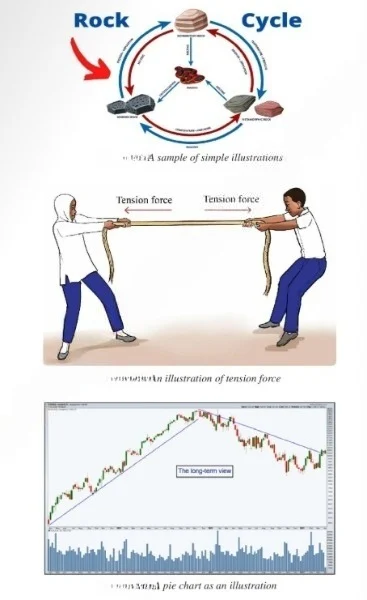
They demonstrate the use of illustrations in an academic document. The writer uses the illustration of the rock cycle in figure 6.3 to explain the process or structure of a rock.
In figure 6.4 the writer uses a simple illustration to explain how tension force take place. In figure 6.5 the writer uses a line chart to compliment his/her technical analysis of price movement. Such illustrations are excellent examples of using illustrations. Simple illustrations also include images that can be downloaded freely from graphic sources.
Criteria for using illustrations in academic documents
The following criteria are to be observed when using illustrations to prepare academic documents:
(a) Creating effective illustrations
This criterion helps to decide which type of illustration will serve the purpose. For example:
i. Maps serve the purpose of longitudinal representations.
ii. Graphs and charts are helpful for percentages and statistical data representations. A data chart or table is applied to illustrate quantitative information.
iii. For technical illustrations, line art is the best. It helps to depict how something works or how to do something.
iv. If there is a need for total realism, it is good to use photographs.
v. Avoid mixed-technique illustrations. When using them, the illustrations look disorderly since each type of technique has its unique style.
(b) Ensure clarity and accuracy
Graphs and diagrams can be powerful tools for clarifying information. However, unclear or inaccurate illustrations can confuse readers. To avoid confusion, ensure
the concept to be illustrated is grasped well before creating an illustration.
If possible, make several drafts for the clearest representation. Get peer feedback on the clarity
of an illustration. You will be sure with the clarity of the illustration if the peer understands the concept without giving more explanation. The illustration is to be modified if there is a need of explanations.
(c) Include labels and subtitles
Use simple words that are clear and concise on the labels and captions of the illustrations to provide information. Complex titles can hinder the purpose of the illustration. Label the important parts of the illustration.
It is important to label the illustration to identify what it is about and provide explanations in relation to the subject of the document. A subtitle for the illustration is normally a sentence or a short phrase, while a label is just a word. For example:
(d) Consistency in style and formatting
Consistency in style and formatting illustrations in a text is important. Changes in font or line weight can carry unintended implications. For example, a change to
italic type for the labelling of a particular component might appear unimportant, but it may be misinterpreted as indicating something special about those components.
Otherwise, a series of drawings of different figures following no consistent pattern in their positioning on the page can appear disorganised but it probably can imply
a particular piece of information. Therefore, if an illustration is to be split and the pieces inserted into different parts of a document, ensure that this is indicated on the original drawing and that the fragments can make sense when viewed individually.
Activity 6.3
Conduct a mini research about any issue of your interest. Write a report about the findings and back up information with illustrations.
Revision questions
1. What is the significance of incorporating illustrations in academic documents?
2. What criteria should be considered to ensure the relevance and reliability of illustrations to be used in an academic document?
3. What strategies will one use to ensure that illustrations complement rather than duplicate the information presented in a textual content of an academic document?
4. Explain how one should analyse the information presented in the illustration and connect it to the accompanying text.
5. How helpful has the understanding of illustrations being to you in creating and using your own visuals for academic projects or presentations?
Project work
Select an area of your interest related to Academic communication, then design and conduct a project.
DOWNLOAD PDF