Linear Motion – Physics Form One Notes
In your life, you have experienced different situations in which bodies are in motion. Examples of such situations include falling leaves from trees, flowing water in rivers, and moving vehicles. If there is a change of position of a body with respect to time, then motion has occurred.
In this lesson, you will learn the distinction between distance and displacement, speed and velocity and the interpretation of distance, displacement, and velocity-time graphs. You will also learn about acceleration and equations of uniformly accelerated motion.
Moreover, you will learn about motion under gravity and how to determine the acceleration due to gravity. The competencies developed from this chapter will enable you to apply motion in daily life situations including riding bicycles, motorcycles, and driving cars.
Concept of motion
An object is said to be in motion when its position is continuously changing relative to a reference point such as an observer or a fixed object. For example, when you walk or run, your position is continuously changing with respect to the ground.
When you see a car (Figure 8.1) passing by the road, it is moving with respect to you. Suppose you are in a car that is moving at the same speed as another car, the other car will not be moving with respect to you. Both cars are now moving with respect to the ground.
Therefore, motion is relative to the observer or some fixed object. Motion in a straight line is referred to as linear motion.
Car in motion past an observer
When scientists study a physical phenomenon like motion, the first step is to observe the event. The second step is to develop the necessary concepts to describe those observations. What are the concepts that are useful in describing motion?
Distance and displacement
To define the position of an object, you first choose a reference point. For example, to measure the position of a book in the classroom shown in Figure 8.2 you could choose a point either on the walls, floor or the ceiling of the room as the reference point.
You would then measure how far the book is from the front wall and side wall, and how far it is above the floor. These three measurements define the unique position of the book. If the book is moved to another position, at least one of these measurements will change.

Books on the table
Distance and displacement are measures of how much the position of an object changes with respect to a reference.
Distance is the length of the path taken by an object while in motion. It has no specific direction.
However, displacement involves the length of the line drawn from the starting (initial) position to the end (final) position in a specific direction shown in Figure 8.3.
Displacement is the distance covered in a particular direction.
The SI unit of both distance and displacement is metre (m). Distance and displacement can also be expressed in centimetre (cm), millimetre (mm) and kilometre (km). Though their SI units are the same, distance and displacement are not used interchangeably. Distance is a scalar quantity while displacement is a vector quantity. A scalar quantity has magnitude only, but a vector quantity has both magnitude and direction.

Distance and displacement
Suppose your home is 1.5 km due south of your school. In the morning, you walk along a straight path to school. The distance travelled is 1.5 km, but the displacement is 1.5 km towards the north. In the afternoon, you follow the same path to go back home.
For that day, you have covered a total distance of 3 km, but your displacement is 0 km because at the end you are in the same position you were in the morning (Final position and initial position are the same).
Distance has magnitude only, but displacement has both magnitude and direction. So, when you walk to school you travel a distance of 1.5 km, but your displacement is 1.5 km due north (your home is south of the school). When you walk home in the afternoon, you again cover a distance of 1.5 km, but your displacement is 1.5 km due south.
Example 1
Halima runs twice round a field track of length 500 m.
(a) What distance does she cover?
(b) What is her displacement from the starting point?
Solution
(a) Distance in actual ground covered;
Distance=Length of track×2
=500 m×2
=1 000 m
(b) Displacement means how far she is from the starting point.
Since she ends the race at the starting point, the displacement is zero metres (0 m).
Speed and velocity
Suppose you and your friend are walking to school in the morning. It takes 45 minutes for you to get to school, but it takes 1 hour and 10 minutes for your friend to get there. If each of you travelled the same distance, 1.5 km, it means you travelled faster than your friend.
Speed is defined as the rate of change in distance. Average speed is the rate at which an object travels.
Speed can be determined as follows:
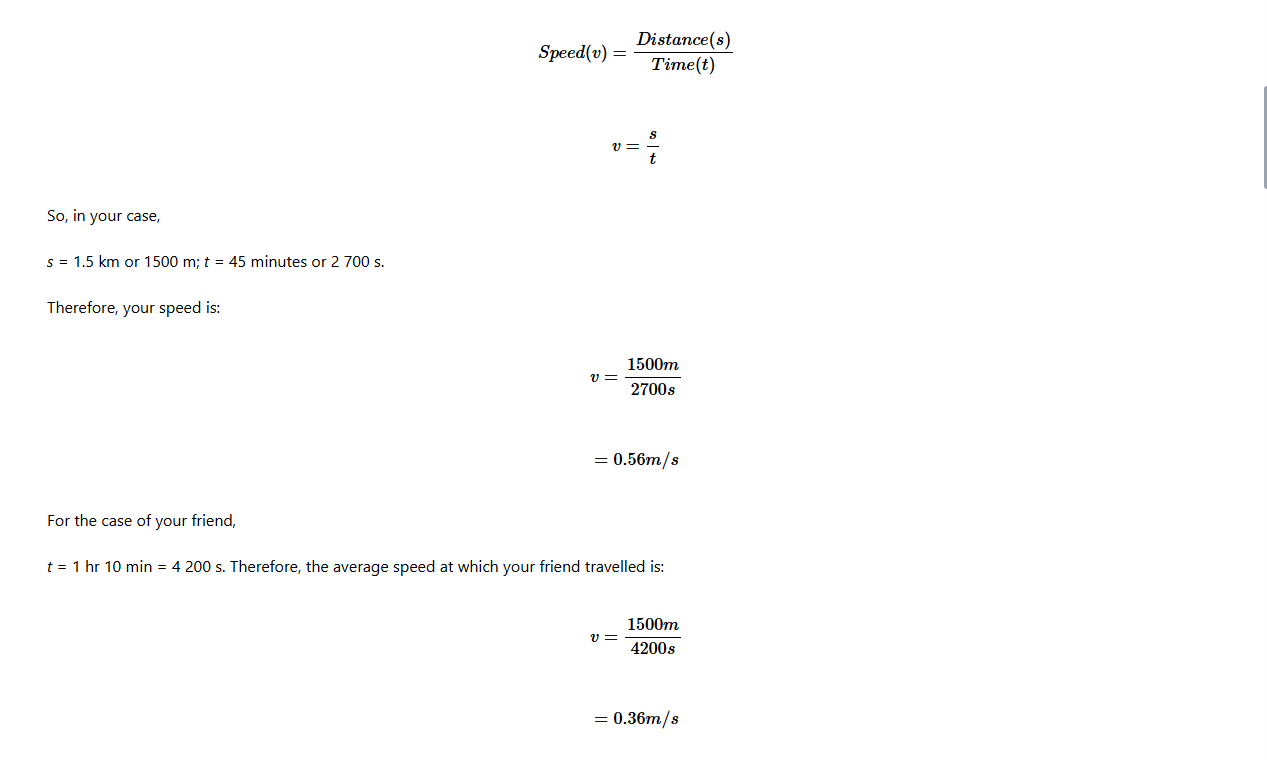
Note: During your journey, you do not maintain the same speed at all times. That is why the term ‘average speed’ is normally used. So, if you walked to school in 45 minutes, your average speed was 0.56 m/s.
Speed may also be expressed in kilometres per hour (km/hr) or in centimetres per second (cm/s).
However, the term speed is usually confused with the term velocity. These terms do not mean the same thing. Velocity is a measure of the speed in a given direction. For example, the speed of a car is 120 km per hour, but its velocity is 120 km per hour in a south-west direction. If a car is moving at a constant speed around a bend, its direction changes continuously. Hence, its velocity will also be changing even if the speed remains constant.
Velocity is the rate of change of distance moved in a specified direction (i.e., the rate of change of displacement).

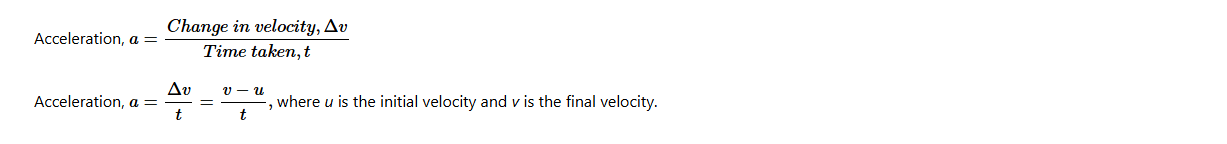
Where, u is the initial velocity, and v is the final velocity.
The SI unit for the magnitude of average velocity is the same as the units for average speed, that is metre per second (m/s).
Note: Velocity at a particular instant is called instantaneous velocity. A body is said to move with uniform velocity if its rate of change of displacement with time is constant.
Example 2
An object travelled a distance of 20 m to the right in 4 s and then 12 m to the left in 3 s. For its total motion, what was its average speed and its average velocity?
Solution
When the object is moving to the right, its displacement is positive and when moving to the left it is negative. Time is always positive.
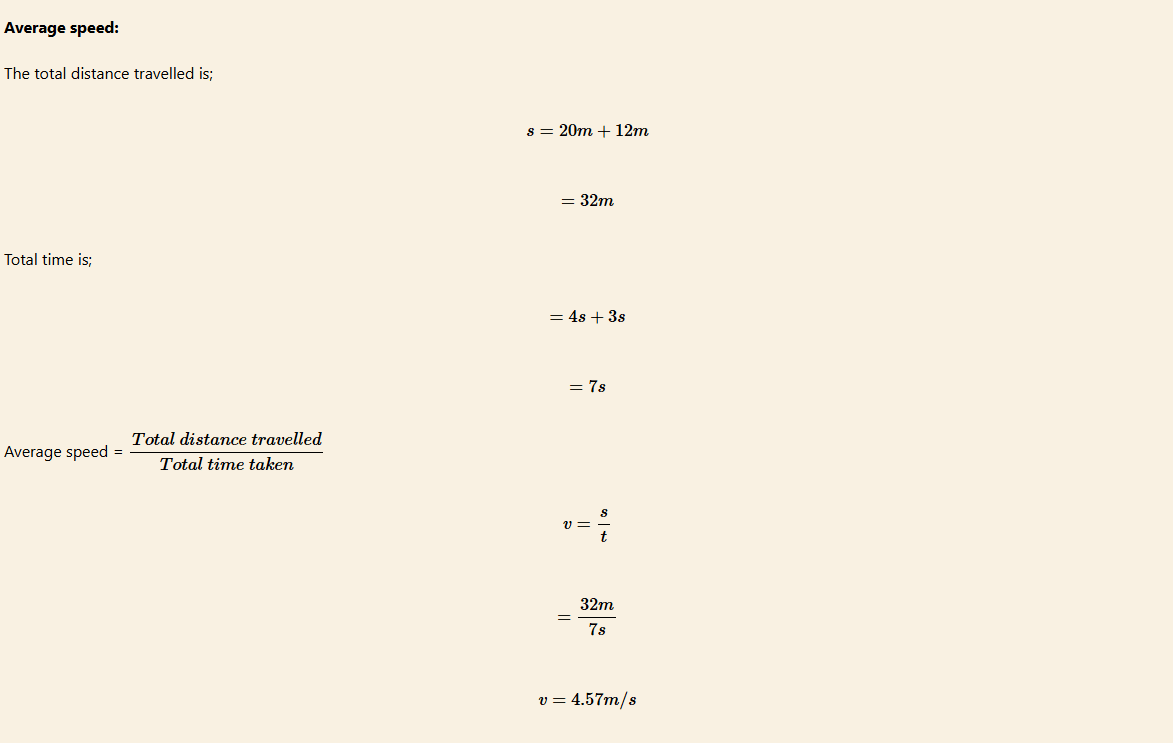
Therefore, its average speed was 4.57 m/s.
Average velocity: To find the average velocity we need to consider the magnitude and direction of the displacement.
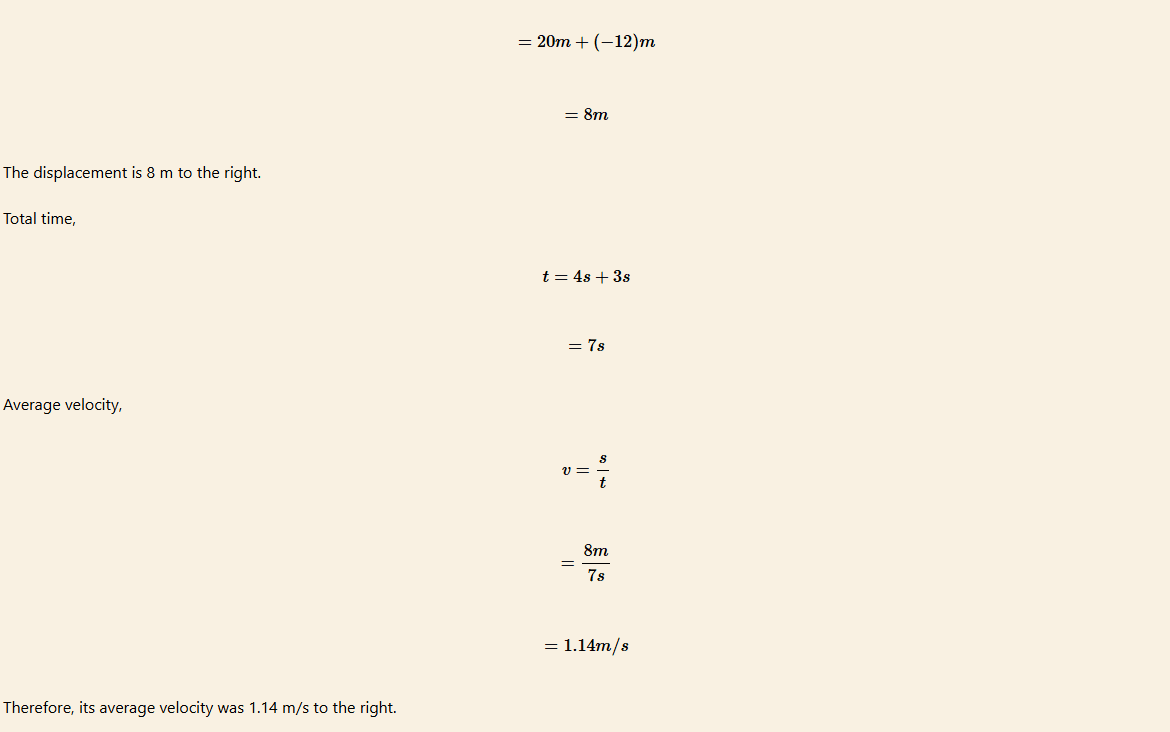
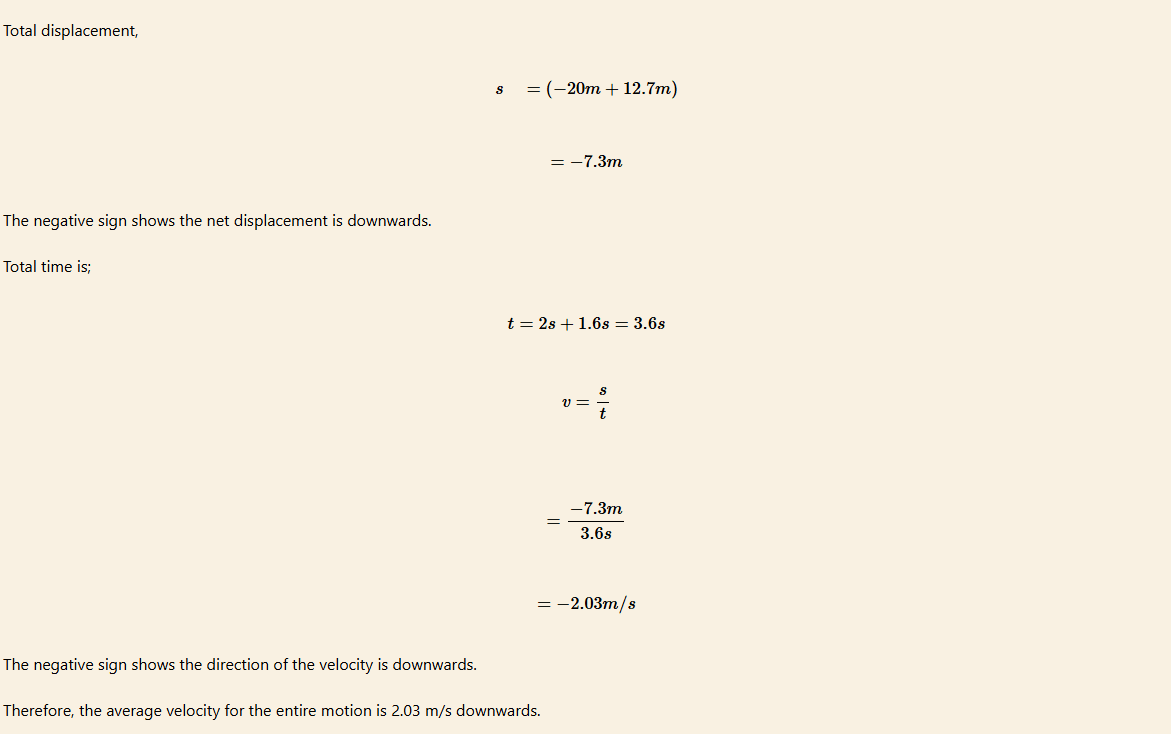
Total Displacement:
Total displacement = displacement to the right + displacement to the left.
Example 3
A ball is dropped from a height of 20 m above the ground. It hits the ground in 2 s and bounces back up to a height of 12.7 m in 1.6 s (see Figure 8.4). What is its average velocity?
Solution
When the object is moving up its displacement is positive and when moving down it is negative.

Exercise 1
1. (a) Why does the average speed of a car which travels 6 000 m in 30 s differ from its actual speed?
(b) Calculate the average speed of the car in (a).
2. What is the average speed of an athlete who runs 1 500 m in 4 minutes?
3. A bus increases its speed steadily from 20 m/s to 30 m/s in one minute.
(a) What is its average speed during this time?
(b) How far does it travel while increasing its speed?
4. A car moves 8 km due south and then suddenly changes its direction and moves another 6 km due west.
Determine:
(a) the total distance covered.
(b) the displacement of the car.
5. A bus travelled 180 km in 4 hours. What was the speed of the bus?
6. What are the differences and similarities between the following pairs of terms?
(a) Speed and velocity.
(b) Distance and displacement.
Task 1
Measure the distance around your class using a measuring tape. Using a stopwatch, record the time when your classmate starts to move from point A, round the class and back to the same point A. Calculate his or her speed.
Acceleration
Task 2
Imagine you are in a car. The driver presses the gas pedal and the car speeds up. This is acceleration. Now, the driver presses the brake pedal and the car slows down. This is deceleration. Discuss how you feel when the car is accelerating or decelerating.
Acceleration is a measure of how quickly an object’s velocity changes. In simple terms, it tells us how fast an object is speeding up or slowing down. If an object is moving with a constant speed, it is not accelerating as described in Activity 8.1. But, when its speed or direction changes, it is accelerates as described in Activity 8.2.
Activity 1
Aim: To determine the velocity of a toy car using a ticker-timer.
Materials: Toy car, ticker-timer, paper tape, remote-control device and stopwatch
Procedure
1. Attach a paper tape onto the toy car.
2. Pass the paper tape through the ticker-timer (see Figure).

3. Set the toy car in motion using a remote-control device.
4. Record the starting time using the stopwatch.
5. Press the remote-control device to stop the toy car after one minute.
6. Record the final stopping time.
Questions
(a) What did you observe when the car was set in motion?
(b) Measure the interval between the marked dots on the paper tape.
(c) Calculate the velocity of the toy car.
(d) Explain your results.

Once the toy car is in motion, dots are made on the paper tape. When calculated, it is found that the time taken between any two consecutive dots is the same. The toy car moves with uniform velocity when the dots are equally spaced (see Figure).

Dots showing uniform velocity
Activity 2
Aim: To determine the acceleration of a toy car using a ticker-timer.
Materials: Toy car, ticker-timer, paper tape, remote-control device and stopwatch
Procedure
1. Attach a paper tape onto the toy car.
2. Pass the paper tape through the ticker-timer (see Figure).

3. Set the toy car in motion down an inclined plane as in Figure 8.7 using a remote-control device.
4. Record the starting time using the stopwatch.
5. Press the remote-control device to stop the toy car after one minute.
6. Record the final stopping time.
Questions
(a) What did you observe when the car was set in motion?
(b) Measure the interval between the marked dots.
(c) Calculate the initial and final velocities of the toy car.
(d) What is the acceleration of the car?
(e) Explain your results.

If the dots are not equally spaced, then the toy is accelerating at that time.

Dots showing acceleration
In Figure 8.8, the interval between two dots is increasing, this means that the toy is accelerating. The velocity can be calculated by measuring the length covered by 8 dots.
Acceleration is a fundamental concept in physics that describes the rate at which an object changes its velocity. Acceleration can occur due to a change in speed, direction, or both. If an object is speeding up, it is said to be accelerating. If it is slowing down, it is decelerating, which is also a form of acceleration but in the opposite direction.
A simple example of acceleration can be observed in a car. When you press the gas pedal, the car speeds up – it accelerates. When you press the brake pedal, the car slows down – it decelerates. The steering wheel allows the car to change direction, which is another form of acceleration.
The SI unit of acceleration is metre per second square, in short m/s2.
The acceleration of an object can be positive or negative. If the acceleration is in the same direction as the velocity, the magnitude of the velocity will increase. If the acceleration and velocity are in opposite directions, the magnitude of the velocity will decrease.
Example 4
An object is initially moving at 15 m/s to the right. Eight seconds later, it is moved at 5 m/s to the left. During those eight seconds, what is the object’s acceleration?

Example 5
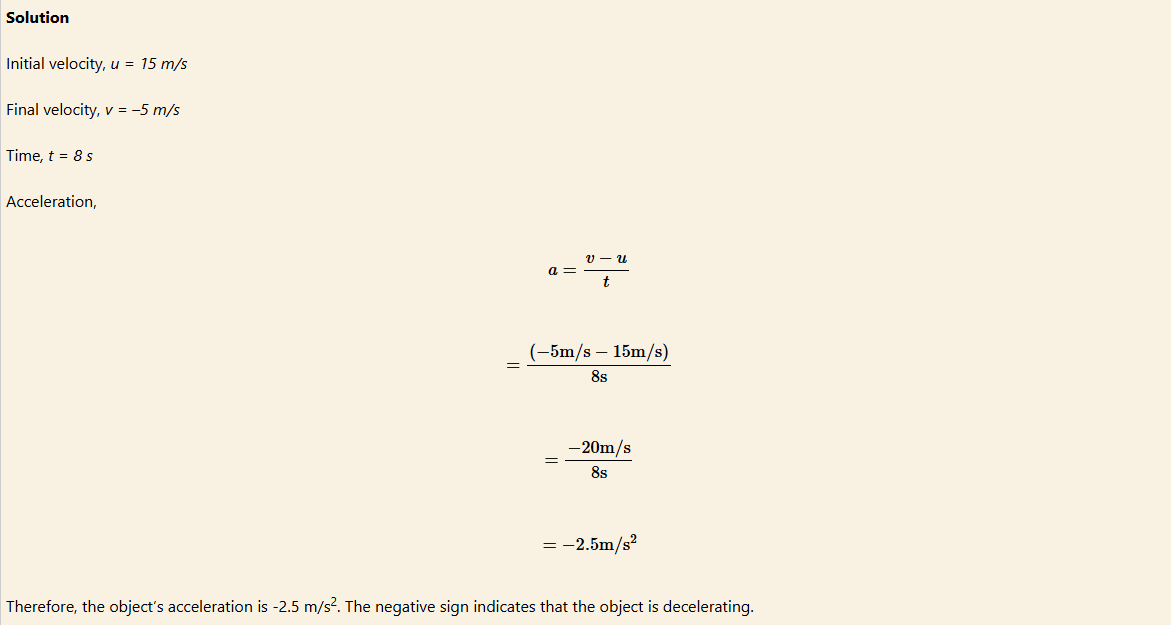
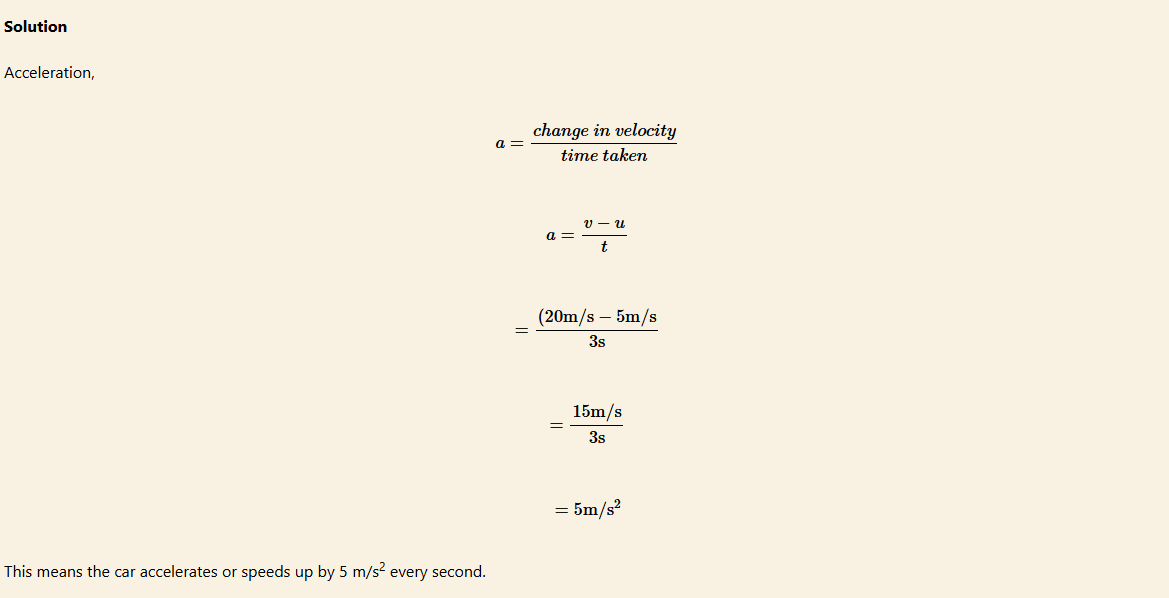
A car accelerates from 5 m/s to 20 m/s in 3 seconds. What is the car’s acceleration?

Distance-time graphs
Graphs can be a useful method of representing relationships between parameters such as displacement, velocity, acceleration and time.
If the distance covered by a body is plotted against the time taken, the graph obtained is a distance-time graph. It shows how far an object has travelled in a given time. Distance is plotted on the y-axis and time on the x-axis. In a distance-time graph, motion at a constant speed is represented by a straight line, and the slope of the line represents the speed of the body (see Figure)

Constant speed distance-time graph
Note that; for motion with acceleration, the slope of the distance-time graph is not constant, that is the graph is a curve. Figure 8.10 shows a distance-time graph, with events represented by numbers 1,2,3,4.

Accelerated motion distance–time graph
1. The body is stationary for a time at a point away from the origin in the direction of increasing distance.
2. The body moves further with a constant positive velocity.
3. The body stops and remains stationary for a time.
4. The body moves backwards past the origin with a constant negative velocity that is greater than its velocity in event 2.
Displacement-time graph
As in the distance-time graph, the displacement of a body is plotted against the time taken. The graph obtained is the displacement-time graph as shown in Figure.

Displacement versus time graph for linear motion
1. The body starts at the origin and moves forward with a constant velocity.
2. The body stops and remains stationary for a while.
3. The body moves backwards with a constant velocity and ends at the origin.
Velocity-time graphs
A velocity-time graph illustrates how an object’s velocity changes over time. The horizontal axis represents time, while the vertical axis represents velocity. The slope of the graph corresponds to the object’s acceleration.
Graph characteristics
1. Constant positive slope
A constant positive slope indicates a uniform acceleration in the forward direction. The object is speeding up (Figure BELOW) as time increases.

Graph for a body moving with constant positive slope
2. Constant negative slope
A constant negative slope represents uniform acceleration in the reverse direction. The object is slowing down (Figure 8.13) as time increases.

Graph for a body moving with constant negative slope
3. Horizontal line
A horizontal line signifies constant velocity, where the object’s speed remains the same as shown in Figure

Graph for a body moving with constant uniform velocity
Activity 3
Aim: Creating a velocity-time graph
Materials: Stopwatch and long stretch of track
Procedure
1. Set up a long track and mark it at regular intervals.
2. Allow a cart or object to roll down the track.
3. Use a stopwatch to measure the time it takes for the cart to travel between each pair of markings.
4. Calculate the velocity for each interval and plot a velocity-time graph.
Interpreting Velocity-Time Graphs

1. Determine the acceleration of the object using the slope of the velocity-time graph.
2. Identify the time intervals when the object experiences positive, negative, and zero acceleration.
3. Calculate the total distance covered by the object during specific time intervals.

Example 6
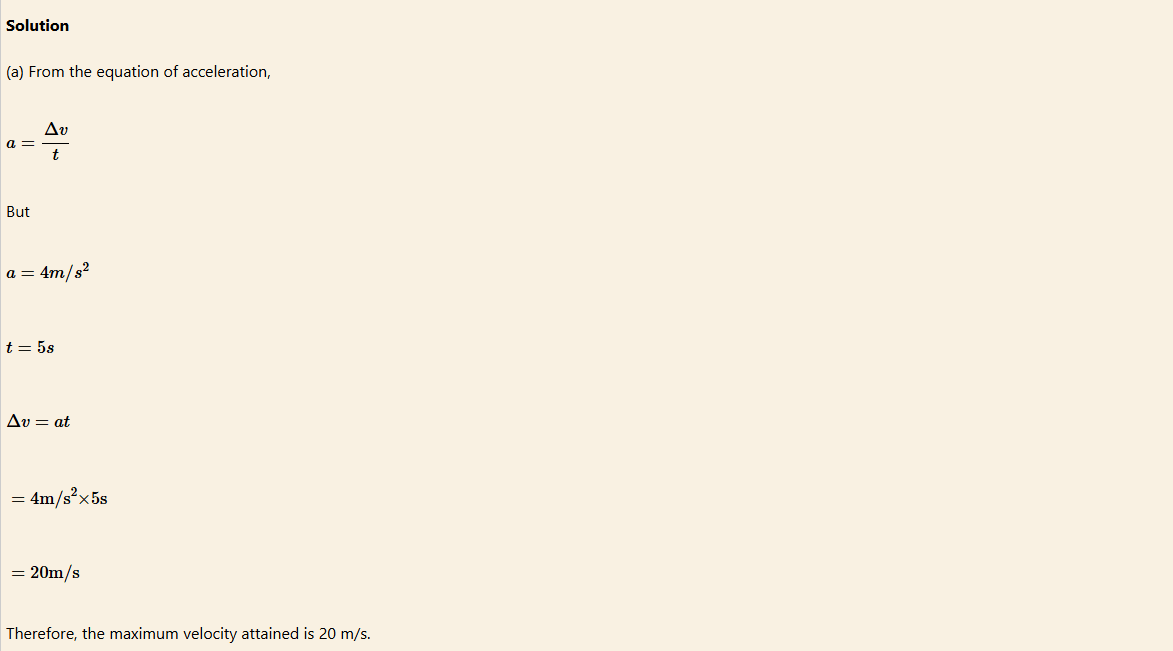
1. A car starts from rest and accelerates uniformly at a rate of 4 m/s2 for 5 seconds. It maintains a constant velocity for 20 seconds. The brakes are then applied, and the car decelerates for 3 s.
Find:
(a) The maximum velocity attained.
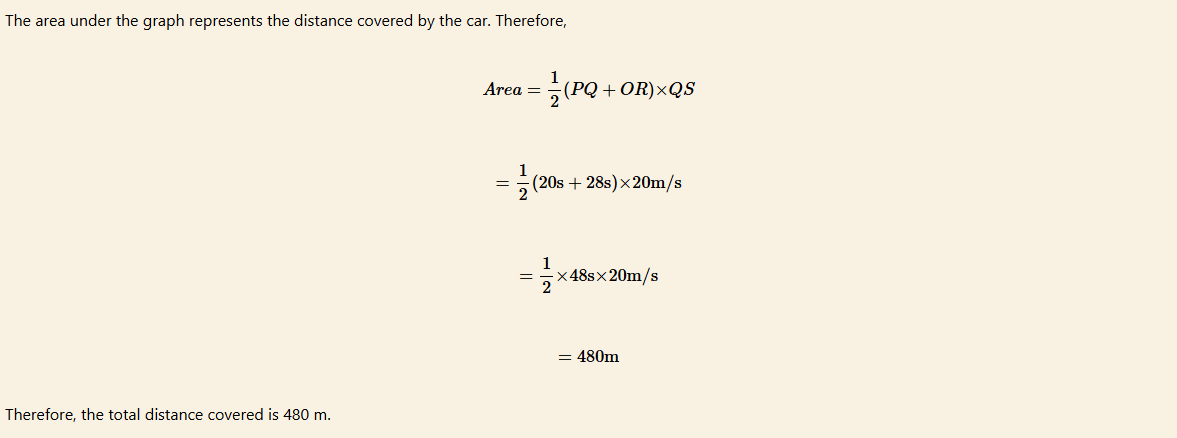
(b) The total distance covered

b) By graphical method.
Figure below shows the graph of velocity (m/s) against time (s).

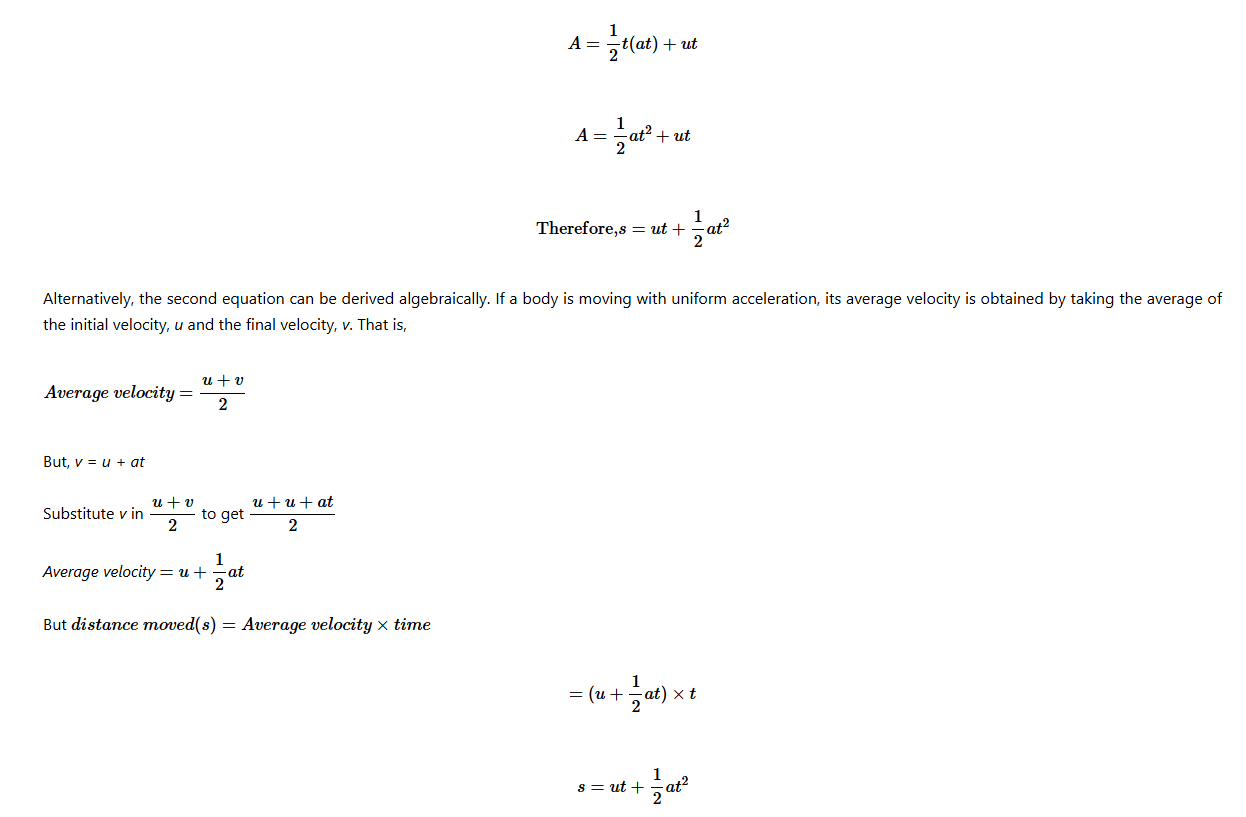
If the acceleration of an object is constant, the velocity will change uniformly, that is, by the same amount each second. In that case, the average velocity is equal to the sum of the initial and final velocities divided by two.
Therefore, for a uniformly accelerated body.
Average velocity=u+v/2
Where, u is the initial velocity and v is the final velocity.
Task 3
Using Figure 8.17, describe how the object was moving. Include where the original position of the object, whether it was moving or not, the direction it was moving, the sign (direction) of the velocity and whether the velocity was constant, increasing or decreasing.
Then sketch the corresponding velocity-time graph in Figure


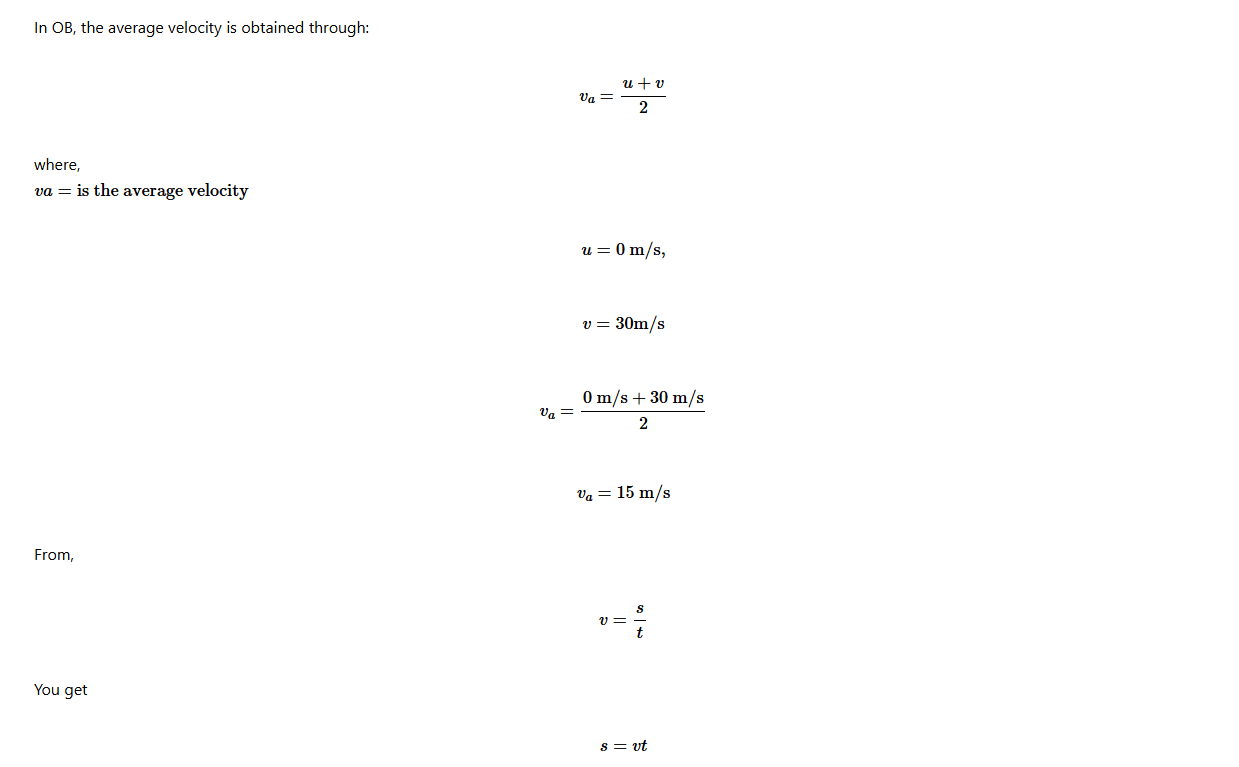
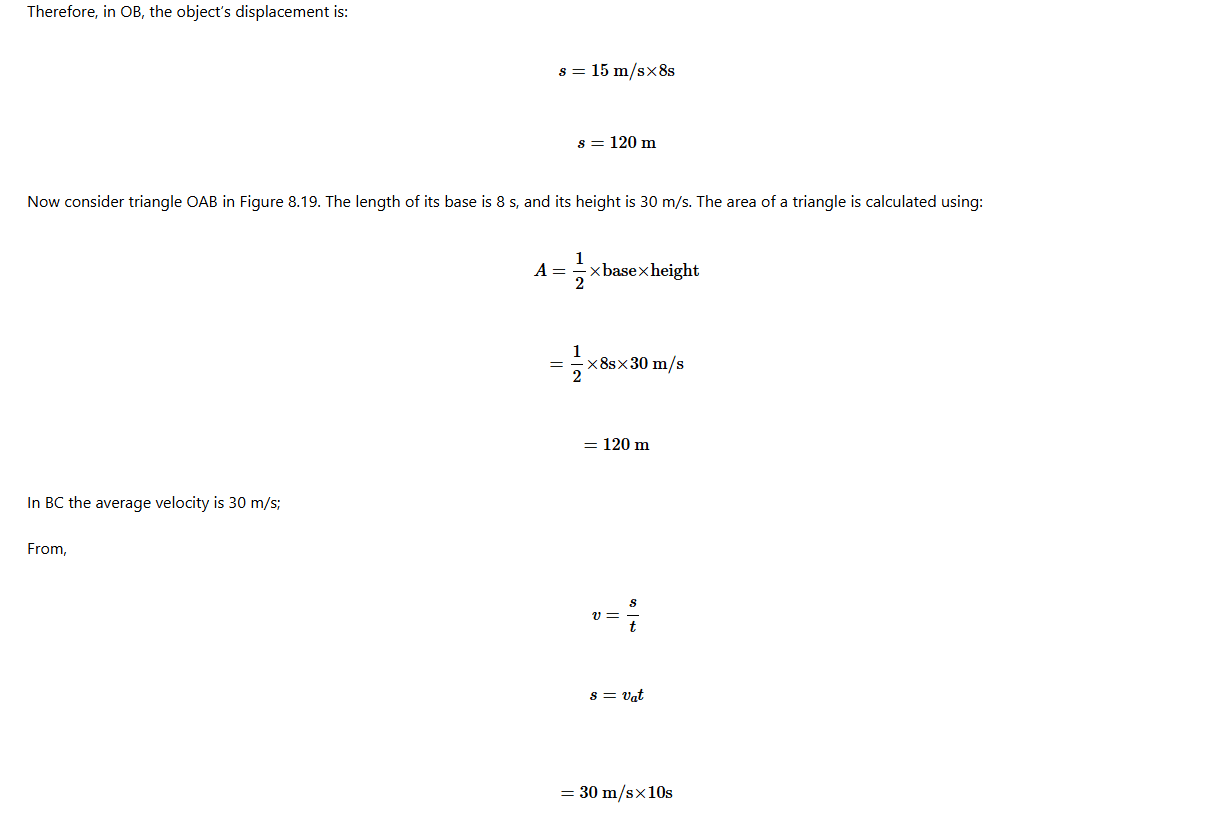
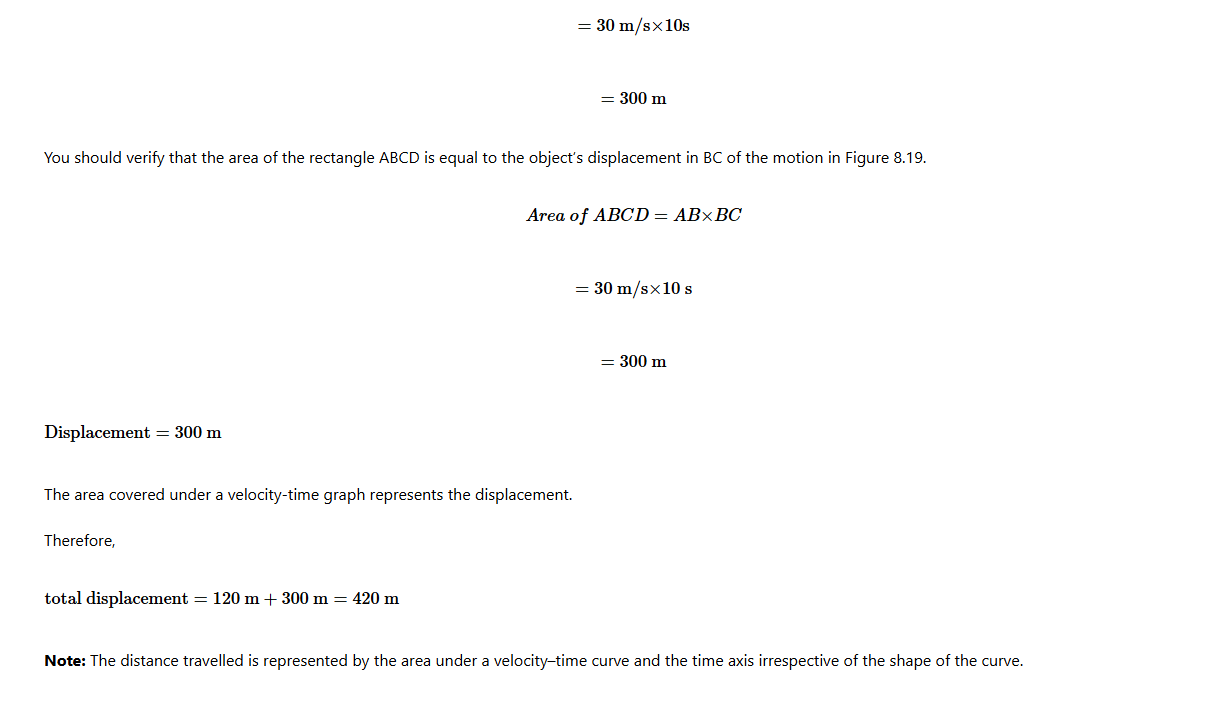
Consider an object that accelerates from zero to 30 m/s in 8 s and then continues at a constant velocity of 30 m/s for another 10 s. A velocity–time graph of this motion is shown in Figure

A velocity–time graph
Plotting the acceleration-time graph
To better understand acceleration, we can use graphs to visualize how an object’s acceleration changes over time. One such graph is the acceleration-time graph. In this graph, time is plotted on the horizontal axis (x-axis), and acceleration is plotted on the vertical axis (y-axis).
When you plot acceleration on the graph, the slope of the line can tell us a lot about how the object is accelerating. The following are different types of acceleration-time graphs might look like.
Constant Positive Acceleration
This indicates that the object is experiencing a constant positive acceleration. This could happen, for example, when a car is steadily increasing its speed.

Acceleration-time graph
Region 1 in Figure 8.20 represents a constant positive acceleration.
Constant Negative Acceleration
This indicates the objects is experiencing a constant deceleration. This could happen when a cyclist applies breaks and slows down. Region 3 in Figure 8.20 represents a constant negative acceleration.
Changing Acceleration
In this graph, the line is curving, indicating that the object’s acceleration is changing over time. This could happen when a roller coaster goes through loops and turns, experiencing varying acceleration.
Task 4
Create a simple roller coaster model using tubes and marbles. Observe how the marble’s speed changes as it goes through different parts of the track. Plot an acceleration-time graph that represents the marble’s changing acceleration.
Exercise 2
1. A body is thrown upward with a velocity of 20 m/s. It returns to the ground at the same position after 8 s.
(a) Sketch a graph of velocity against time for the motion.
(b) From the graph, determine the distance travelled and
(c) The total displacement.
2. Observe Figure 8.21 which shows a graph for a motorcycle travelling along a straight road, then answer the questions that follow:

(a) When is the motorcycle:
(i) accelerating? (ii) decelerating?
(b) Calculate its distance from A to D.
3. Amina drove her car from rest to a speed of 30 m/s in 10 seconds. She maintained this steady speed for 10 seconds, after which she applied the brakes and stopped after 5 seconds.
(a) Draw a graph of speed against time.
(b) From the graph in (a) above calculate:
(i) the total distance travelled.
(ii) the time taken for the whole journey.
(iii) the maximum speed attained.
(iv) the area under the graph.
4. What is meant by uniform speed, uniform velocity and uniform acceleration?
Equations of linear motion
Equations of linear motion play a crucial role in understanding and predicting the behaviour of objects in motion. By comprehending these equations and their applications, we gain insights into the fundamental principles that govern the physical world. Three equations describe the uniformly accelerated linear motion: the first, second, and third.
Derivation of the equations of the uniformly accelerated linear motion
Derivations of the equations of linear motion can be done by employing techniques like graphical methods and algebraic methods. These are the common methods used in deriving the equations of linear motion.
Using velocity-time graph
Consider an object moving with an initial velocity u and a final velocity v shown in Figure

Velocity-time graph
(a) The first equation of the linear motion is derived by computing the slope under the velocity time graph. The slope under the velocity time graph represents the acceleration.
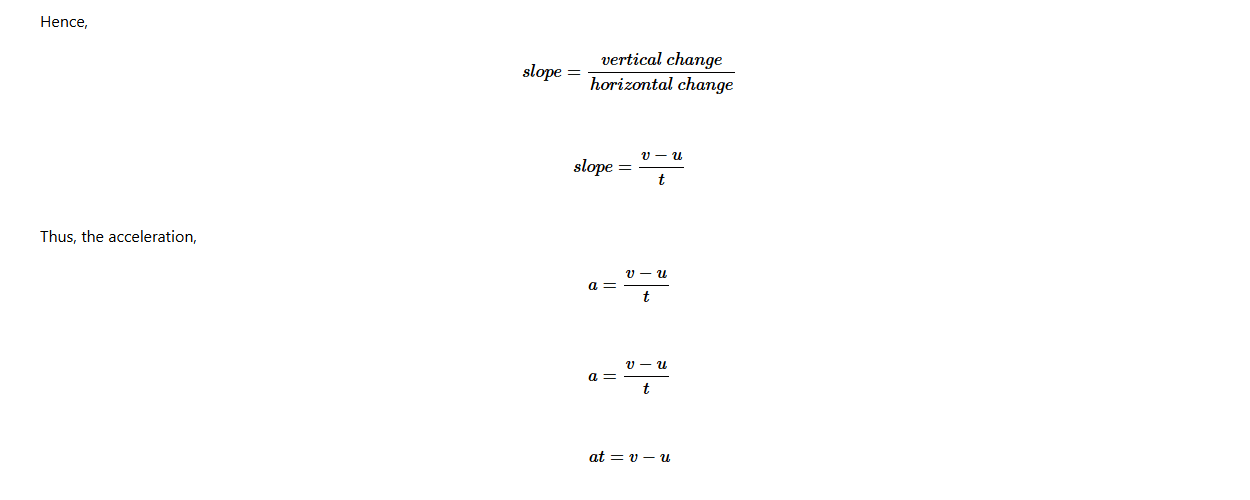
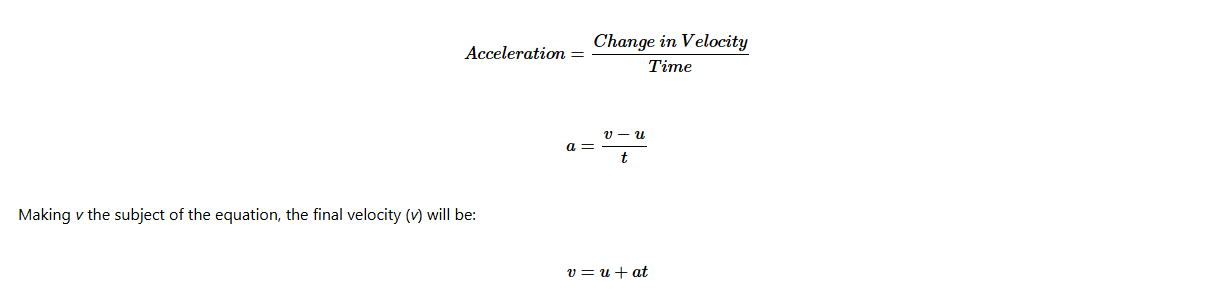
The first equation aims to find the final velocity, v. Thus, transforming
the variables v = u + at
Alternatively, you can derive the equation of the linear motion algebraically.
The first equation of motion is derived from the definition of acceleration. That is, acceleration is the rate of change of velocity.
This is the first equation of motion.
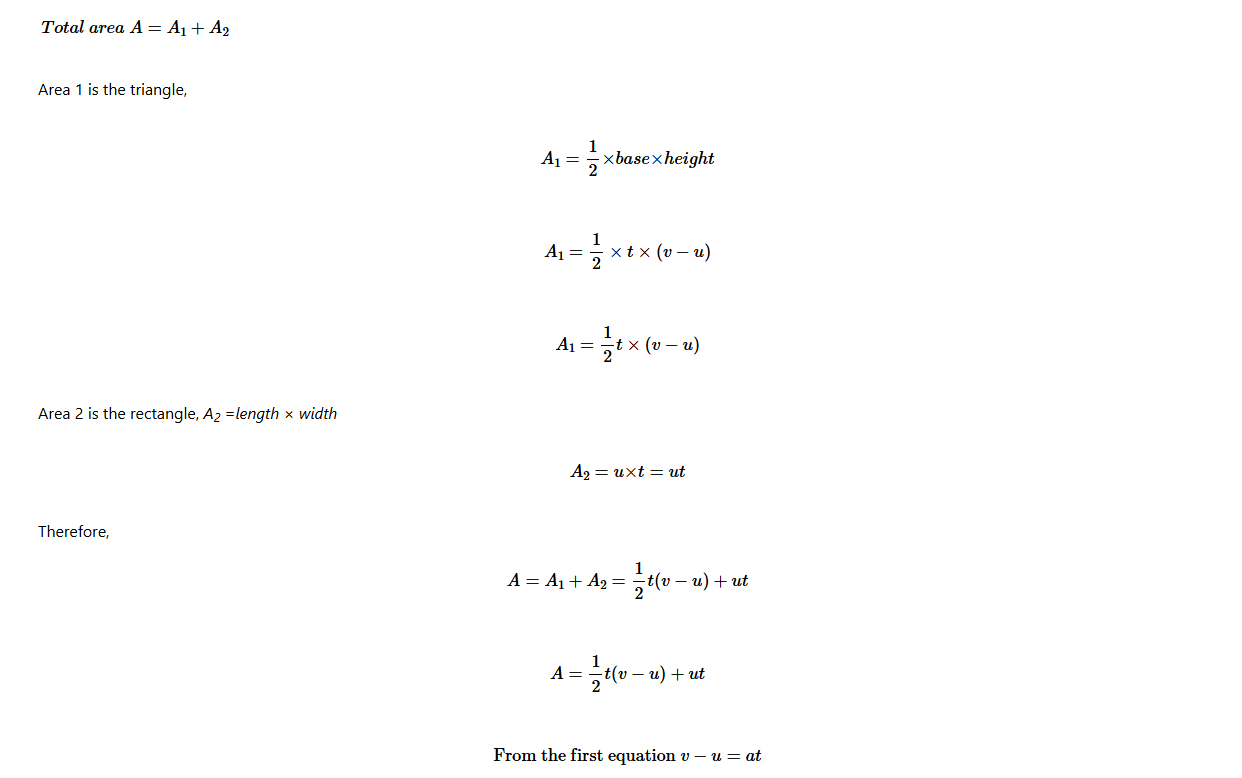
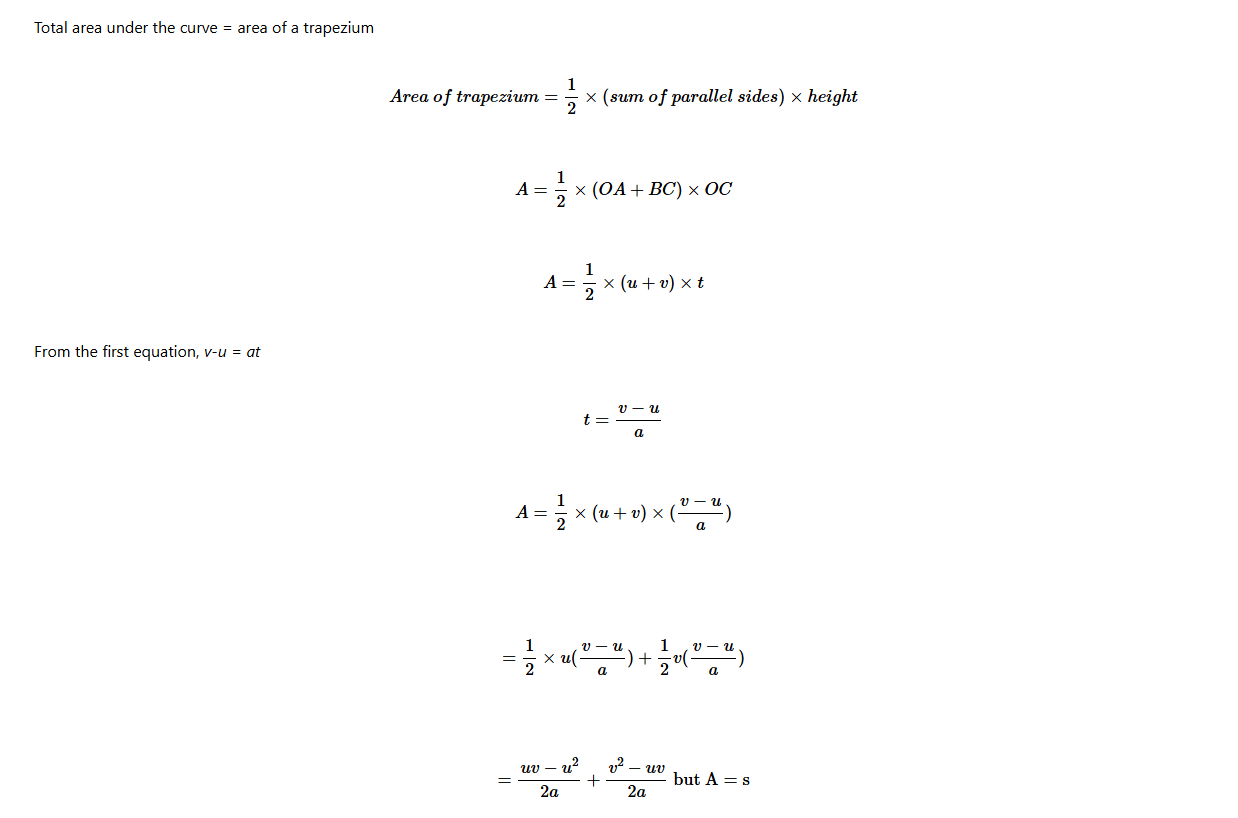
(b) The second equation of the linear motion aims at finding the total distance, s, travelled by the body. From the velocity time graph, the total distance travelled by the body is given by the total area under the graph. Thus, we need to calculate the total area under the graph. Consider the shaded area in Figure

Velocity-time graph
(c) The third equation of the linear motion
The third equation of the linear motion can be derived from the concept of area under the velocity-time graph shown in Figure


Example 7
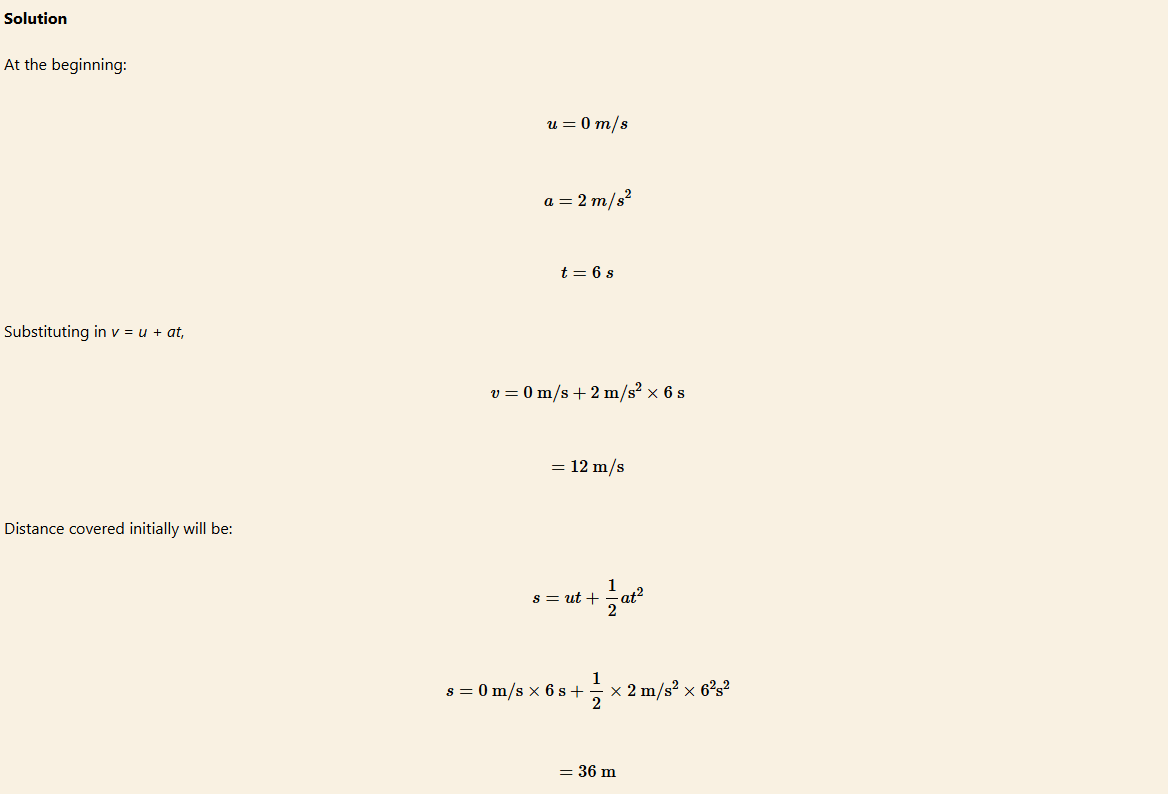
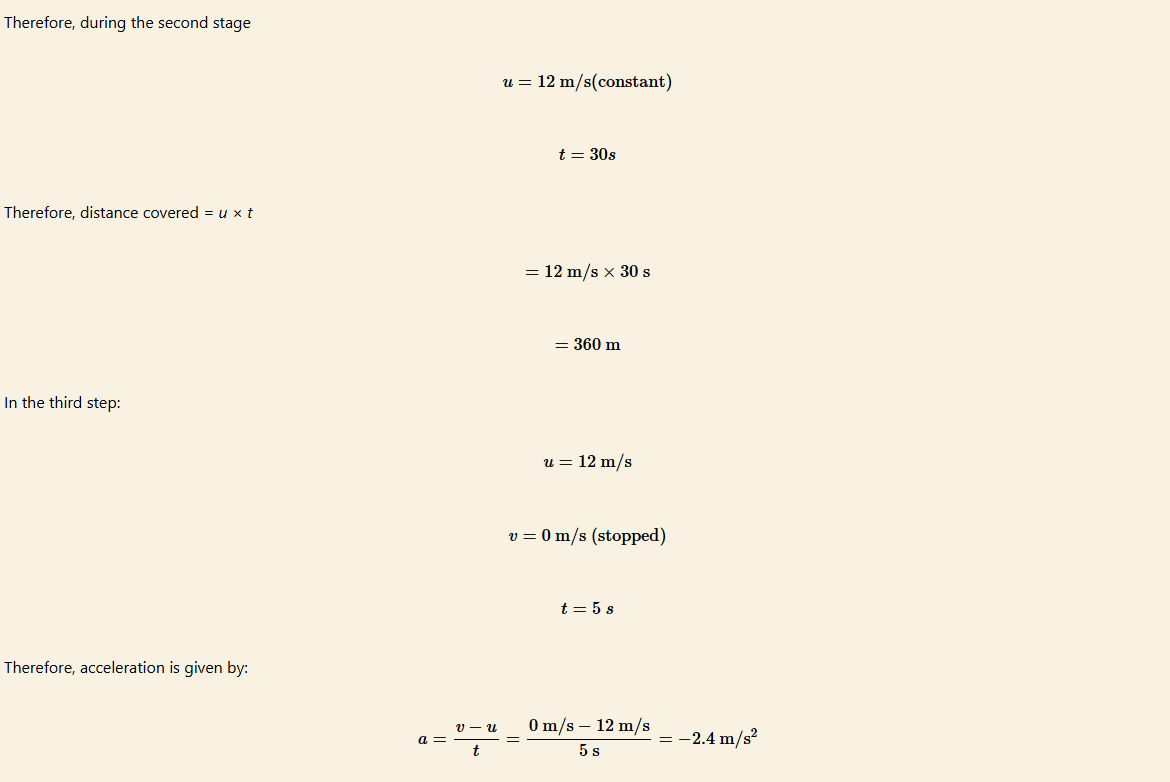
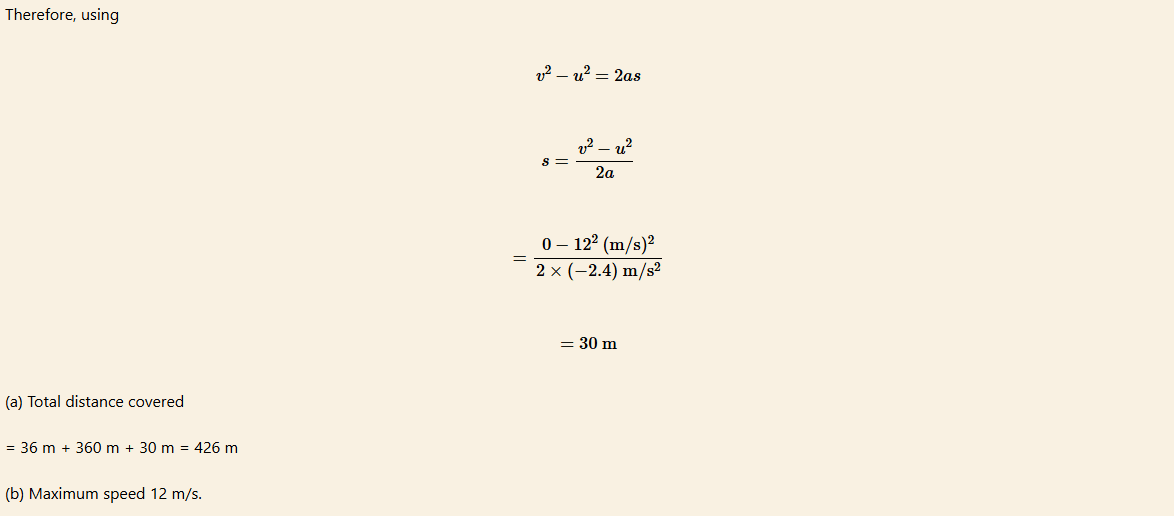
A car starts from rest and accelerates uniformly at the rate of 2 m/s2 for 6 s. It then maintains a constant speed for 30 seconds. After the brakes are applied, it decelerates uniformly to rest in 5s. Calculate:
(a) the total distance covered in metres.
(b) the maximum speed reached.

Exercise 3
1. A train travelling at 30 km/h stops when its brakes are applied. The train suffers a deceleration of 2 m/s2.
(a) How long does the train take to come to rest?
(b) What is its final velocity?
2. An object travelling at 10 m/s accelerates at 4 m/s2 for 8 seconds.
(a) Calculate the final velocity.
(b) How far does it travel for 8 seconds?
3. A car moves with a uniform velocity of 12 m/s for 6 seconds. It accelerates at 2.0 m/s2 for 4 seconds. It then travels for 2 more seconds with uniform velocity. The car finally decelerates to a stop in 15 seconds. Calculate:
(a) the distance travelled in 5 seconds
(b) average velocity for the journey, assuming that the journey is in a straight line.
4. An object with an initial velocity of 20 m/s moves due to north at an acceleration of 8.0 m/s2 for 5 seconds. What is the total displacement during that time?
Reaction time and stopping distance
In the realm of linear motion, understanding the concept of reaction time and its impact on stopping distance is crucial for safety and efficient transportation.
Reaction time
Reaction time refers to the time it takes for an individual to perceive a stimulus, such as an obstacle in the road, and then initiate a response, typically applying the brakes in the context of driving. During this reaction time, an object in motion continues to move, and this motion is described by the principles of inertia and linear momentum. Reaction time depends on, the person making the decision and the situations/surroundings in which the reaction time is taking place.
Stopping distance
The stopping distance of a moving vehicle is directly influenced by the reaction time of the driver. To delve into the physics behind this relationship, we can apply the equations of linear motion. The stopping distance (d) of a vehicle is determined by two primary factors: the initial velocity (v) of the vehicle and the stopping capacity/braking capacity of the vehicle, that is, how fast the vehicle can decelerate.

The relationship can be expressed as:
s=ut+1/2at2
Where: s is the stopping distance, v is the initial velocity of the vehicle, t is the driver’s reaction time, a is the deceleration or braking force applied to the vehicle. The first term, ut , represents the distance travelled by the vehicle during the driver’s reaction time, while the second term, 1/2at2, represents the distance travelled during the actual braking process, where a is negative to signify deceleration.
Understanding this physics equation emphasizes the critical importance of reducing reaction time through increased alertness and attention while driving, as well as the significance of having efficient braking systems to minimize stopping distances. Ultimately, grasping the interplay between reaction time and stopping distance is fundamental in the realm of linear motion, promoting safer and more effective transportation.
Deriving formula for stopping distance
At the stopping point, the vehicle has applied the brakes, and now it has to come to a stop. The final velocity will become zero, hence, v = 0. Now, applying the third equation of motion in this case of non-uniform motion:
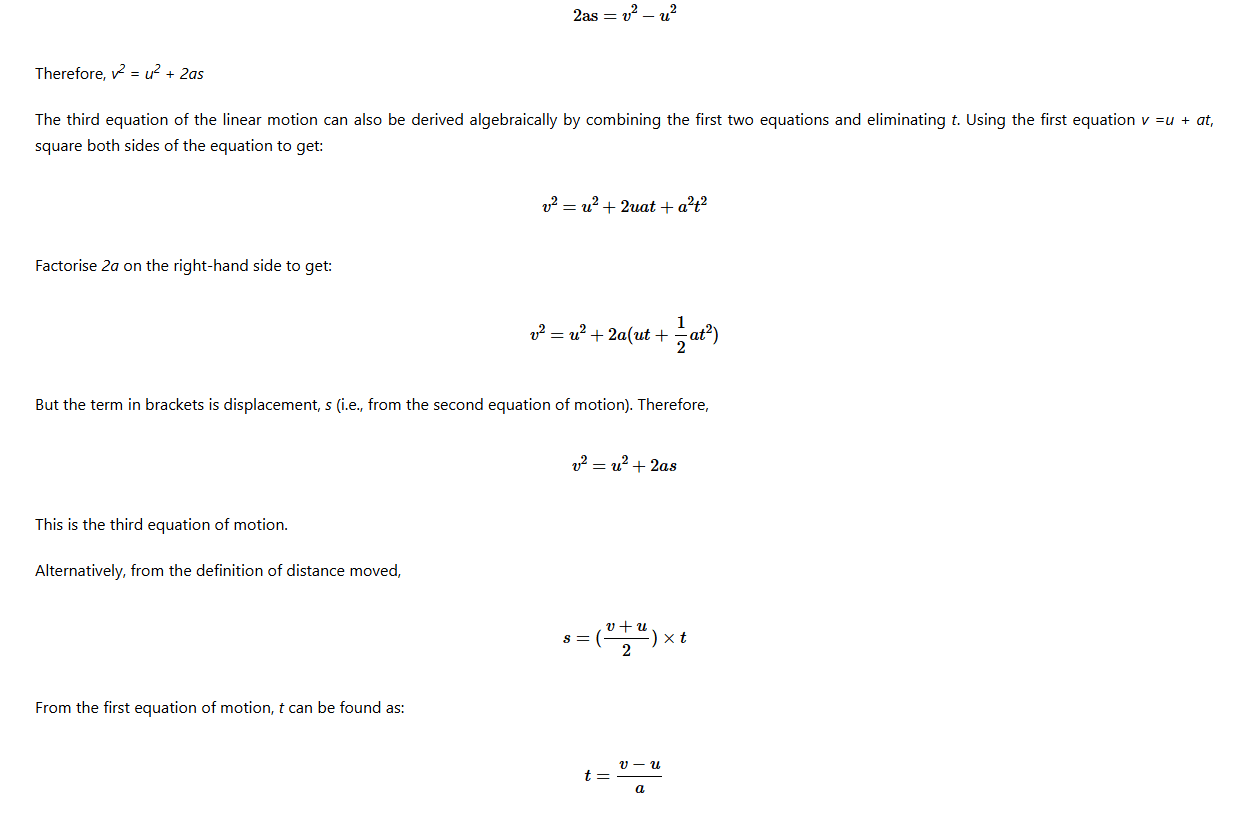
v2 = u2 + 2as
0 = u2 + 2as
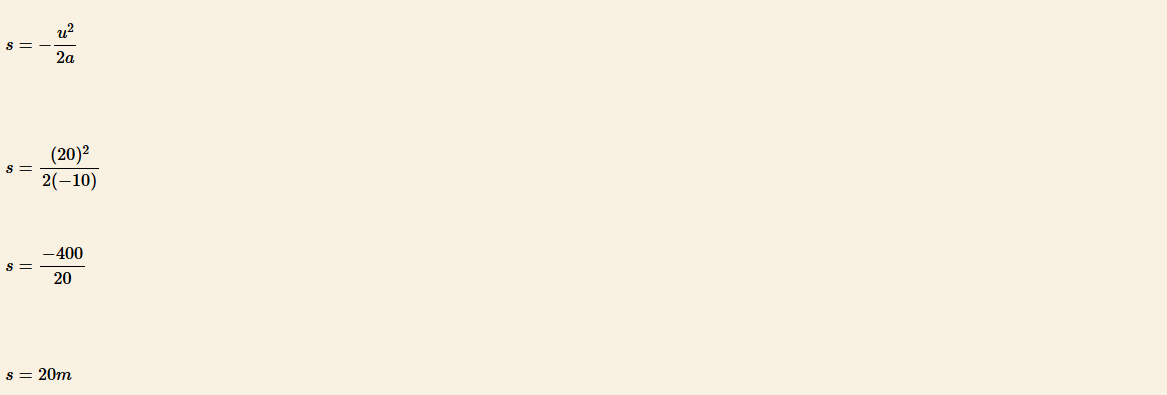
s = v2/2a
Now, it is important to notice that a is taken in negative since the vehicle is decelerating. Hence, the stopping distance will finally come out to be positive.
Deriving formula for Reaction time
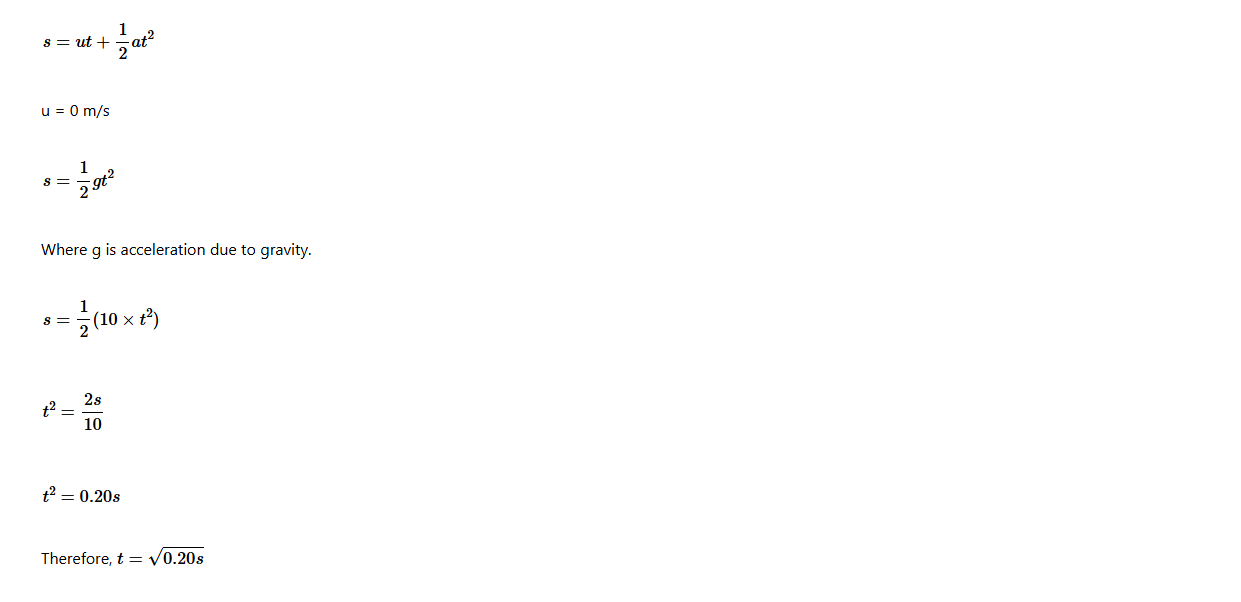
Imagine the case of a free-falling object and the time it takes to react and catch it to find the reaction time. Keep in mind that the initial velocity will be zero since the object is freely falling. Applying the second equation of motion to find the reaction time of the vehicle:
Example 8
A car has a velocity of 20 m/s and the braking capacity of the car is given as 10 m/s2. What will the stopping distance be for the car?
Solution
Since the acceleration occurs in negative direction, a = -10 m/s2
Applying formula for stopping distance,
Example 9
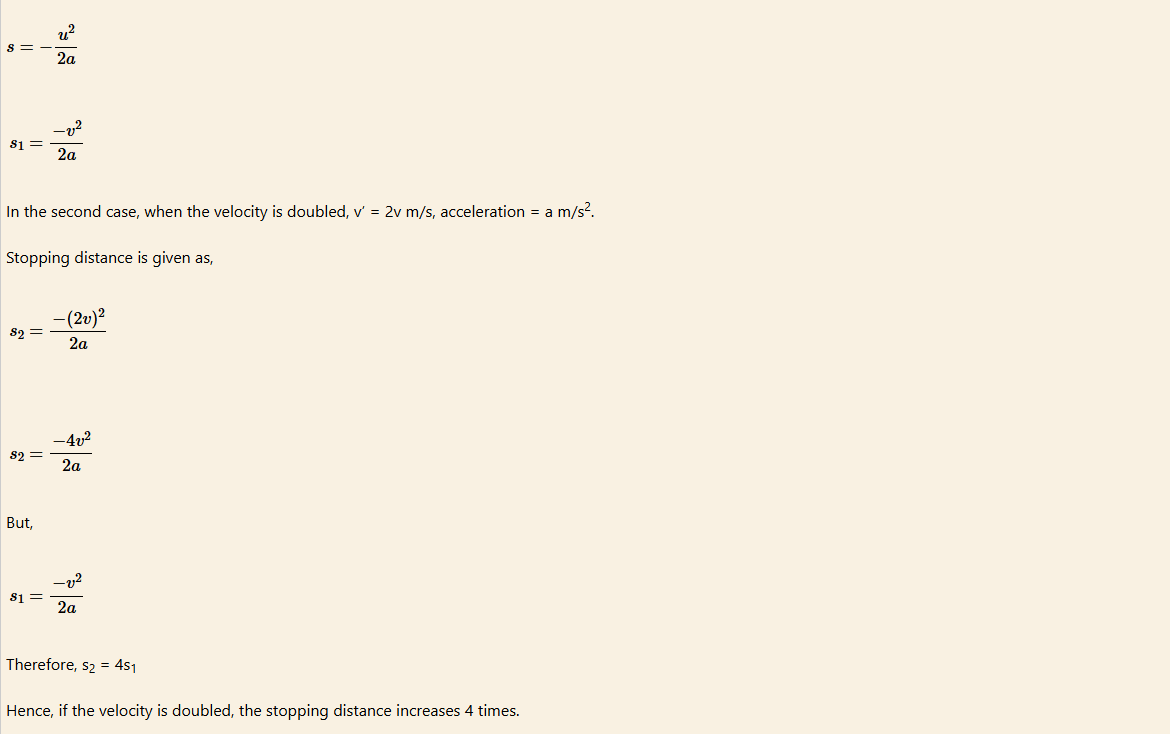
How will the stopping distance be affected if the velocity of the vehicle is doubled?
Solution
Imagine in the first case, the velocity of the vehicle was v m/sec and the acceleration was a = -10 m/s2. Now, stopping distance in the first case is given as,
Motion under gravity
If a ball is thrown straight up into the air, it will move upward. However, due to Earth’s gravity, it will momentarily stop, and then, fall downwards. When the ball is falling, the magnitude of its velocity increases because the direction of its acceleration is downwards. The force of gravity and the acceleration of this body are always directed downward towards the centre of the earth. The acceleration in this case is called acceleration due to gravity, g. The value of g is 9.8 m/s2 or approximately 10 m/s2.
The point where the ball momentarily stops is the maximum altitude reached by the body. Due to constant acceleration, the ball will take the same time to reach its maximum altitude as it does when returns to its starting point.
Objects falling under the influence of gravity are moving with constant acceleration.
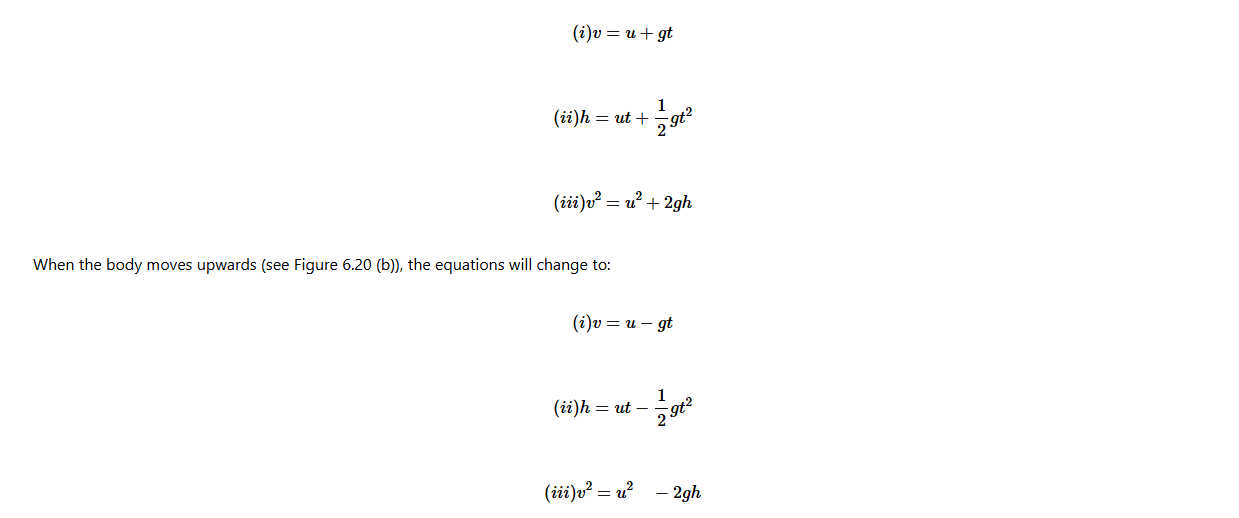
The equations of motion for a free falling body (see Figure 8.26 (a)) will be:
(i) v =gt
(ii) h=1/2gt2
(iii) v = 2gh

Note that, h is being used instead of s and g instead of a. For a body moving/thrown downwards, the following equations are applied:
The negative sign in the equations indicates that the body is moving upwards against acceleration due to gravity.
For a body moving upwards, the velocity at the turning point is zero.
Example 10
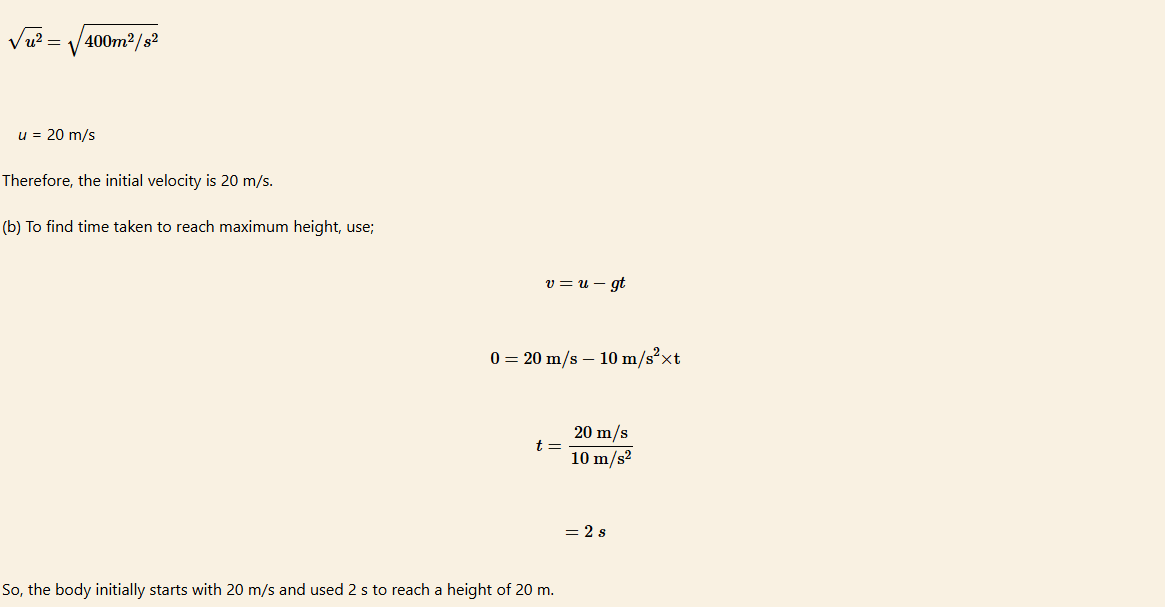
A body moved vertically upward to a maximum height of 20 m. Calculate:
(a) the initial velocity.
(b) the time taken to reach the maximum height.

Solution
(a) From v2 =u2 – 2gh;
where
v = 0 m/s, h = 20 m and g = 10 m/s2
v2 =u2 -2 ×10m/s2 × 20m
0 =u2 – 2 ×10m/s2 × 20m
u2 =2 ×10m/s2 × 20m
Exercise 4
1. A stone falling down a well takes 2 s to reach the water surface. Calculate:
(a) the velocity with which the stone hits the water surface.
(b) the distance of the water surface from the top of the well shaft.
2. A stone is thrown vertically upwards with an initial velocity of 29.4 m/s from the top of a tower 34.3 m high. Find:
(a) the time taken to reach the maximum height.
(b) the total time that elapses just before it reaches the ground.
3. A car is travelling at 20 m/s along a straight road. The brakes are applied for 5 s causing a retardation of 3 m/s2. Find the car’s final velocity.
Determination of the acceleration due to gravity
Early studies related to motion of objects under gravity were conducted by Galileo Galilei between the 16th and 17th centuries. Galileo was an Italian physicist, mathematician, astronomer and philosopher who was closely associated with the scientific revolution. His achievements include the first systematic studies of uniformly accelerated motion, improvements to the telescope and a variety of astronomical observations.
Galileo understood that free-fall was a uniformly accelerated motion. The problem he faced in studying this motion was in measuring time. He discovered that over short distances of a few metres, free-fall occurs very rapidly. In Galileo’s days, there were no clocks capable of accurately measuring very short periods.
Therefore, he used his heart pulse to measure time in many of his experiments. Later, he developed a water clock and a pendulum clock, but none of these were capable of measuring time precisely. To overcome this problem, Galileo studied objects rolling down inclined planes, which slowed the motion sufficiently for accurate measurements to be made. Figure 8.27 shows a body rolling down an inclined plane.

Body rolling down an inclined plane
Even using the inclined plane, Galileo was not able to accurately determine the acceleration due to gravity. One way in which the value for the acceleration due to gravity could be determined was by observing the motion of a simple pendulum.
A pendulum consists of a bob suspended by a wire or string from a pivot point. When the pendulum bob is displaced from its equilibrium position and released, the pendulum swings back and forth in periodic motion as shown in Figure

A simple pendulum
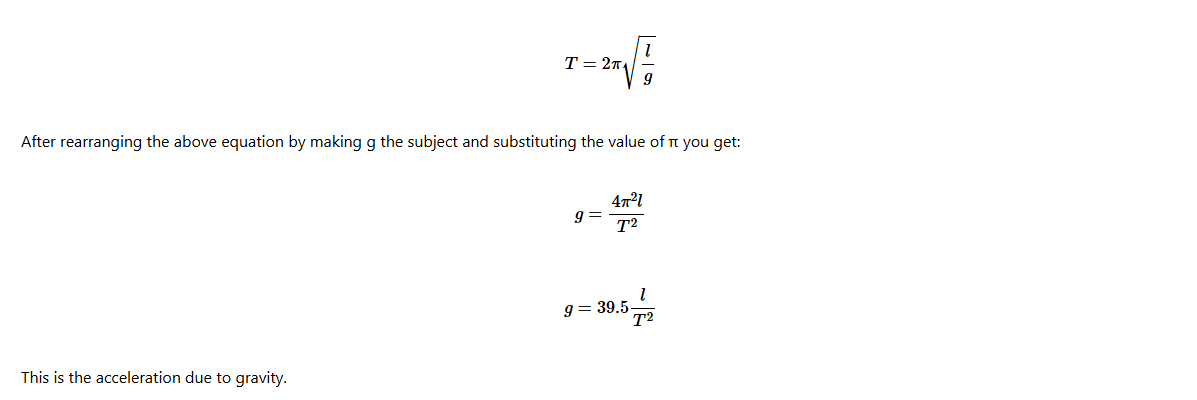
The time for the pendulum bob to swing back and forth, to complete an oscillation is called its period, abbreviated as T. When a pendulum moves forth and back once,it completes an oscillation. The period of oscillation of the pendulum depends on its length, l and the acceleration due to gravity, g, and given as
Activity 4
Aim: To determine the acceleration due to gravity using a simple pendulum bob.
Materials: Retort stand, stopwatch, clamp, thread, metre rule, and pendulum bob
Procedure
1. Measure 90 cm of a thread by using the metre rule. Tie the bob to one end of the thread and suspend the bob from the retort stand so that it swings freely.
2. Displace the bob through a small angle sideways and release it so that it oscillates.
3. Record the time taken for 20 oscillations using the stopwatch.
4. Repeat step 3 thrice.
5. Repeat steps 1- 4 for a thread of length l = 80 cm, 70 cm, 60 cm, and 50 cm.
6. Tabulate the results in the following table.
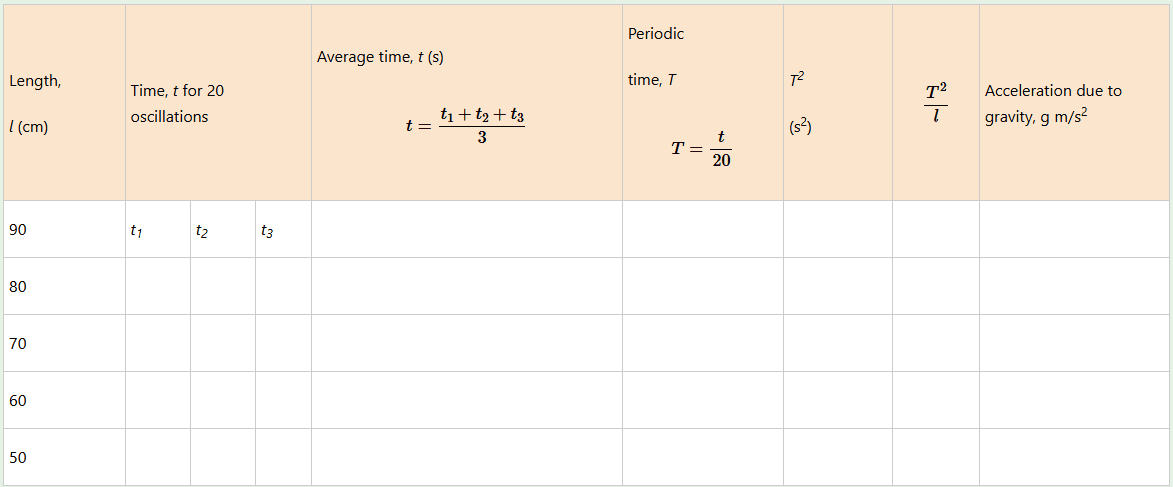
Questions
(a) Use a table similar to the one shown above to calculate:
(i) the average time for 20 oscillations.
(ii) the average periodic time, T (time for one oscillation).
(b) Plot a graph of T2 against l and calculate its slope.
(c) What is the nature of the plotted graph?
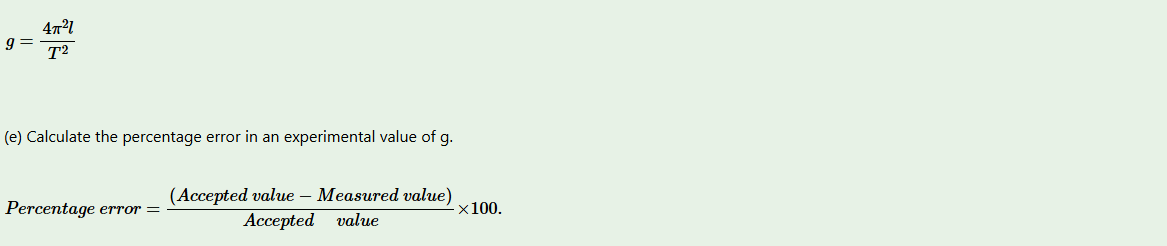
(d) Calculate the acceleration due to gravity, g using the formula,

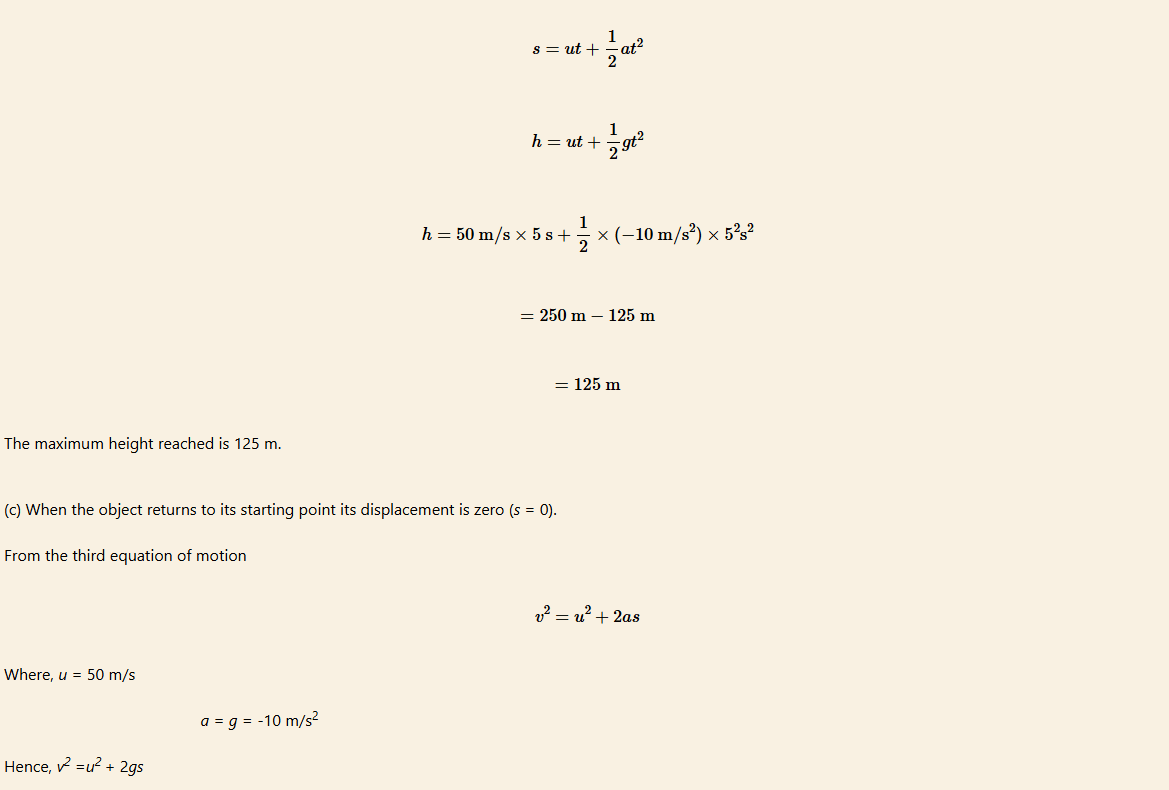
Example 11
An object is thrown vertically upwards with an initial velocity of 50 m/s.
(a) How long will it take to reach its maximum height?
(b) To what height will it rise?
(c) What will be its velocity when it returns to its starting point?
(d) How long will it be in the air?

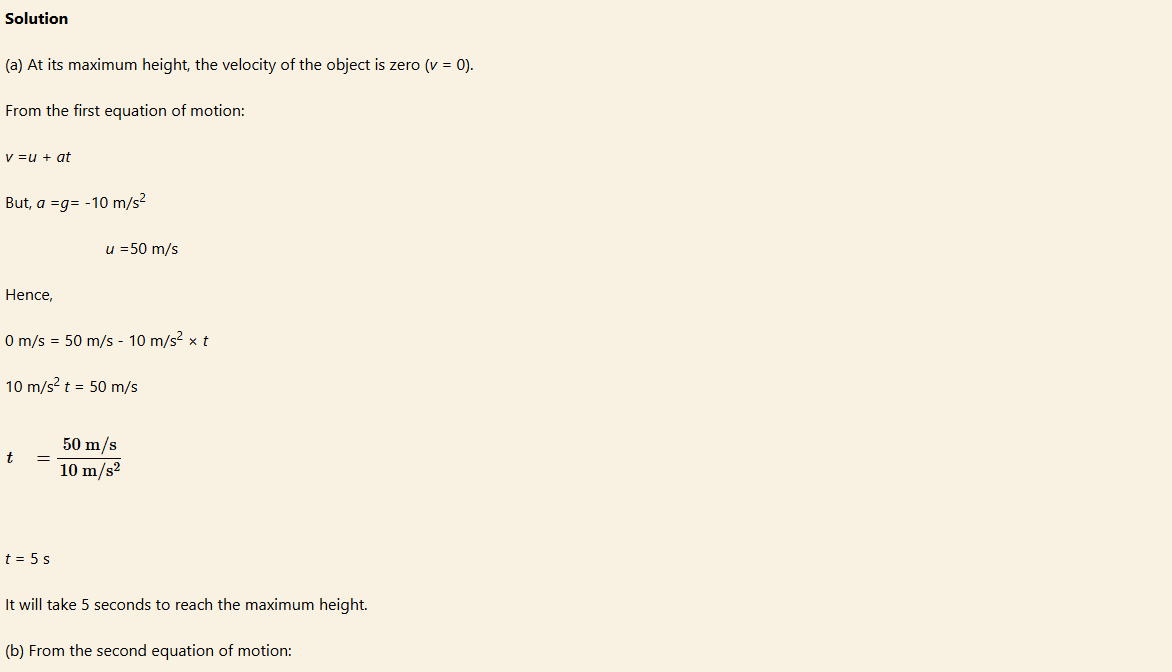
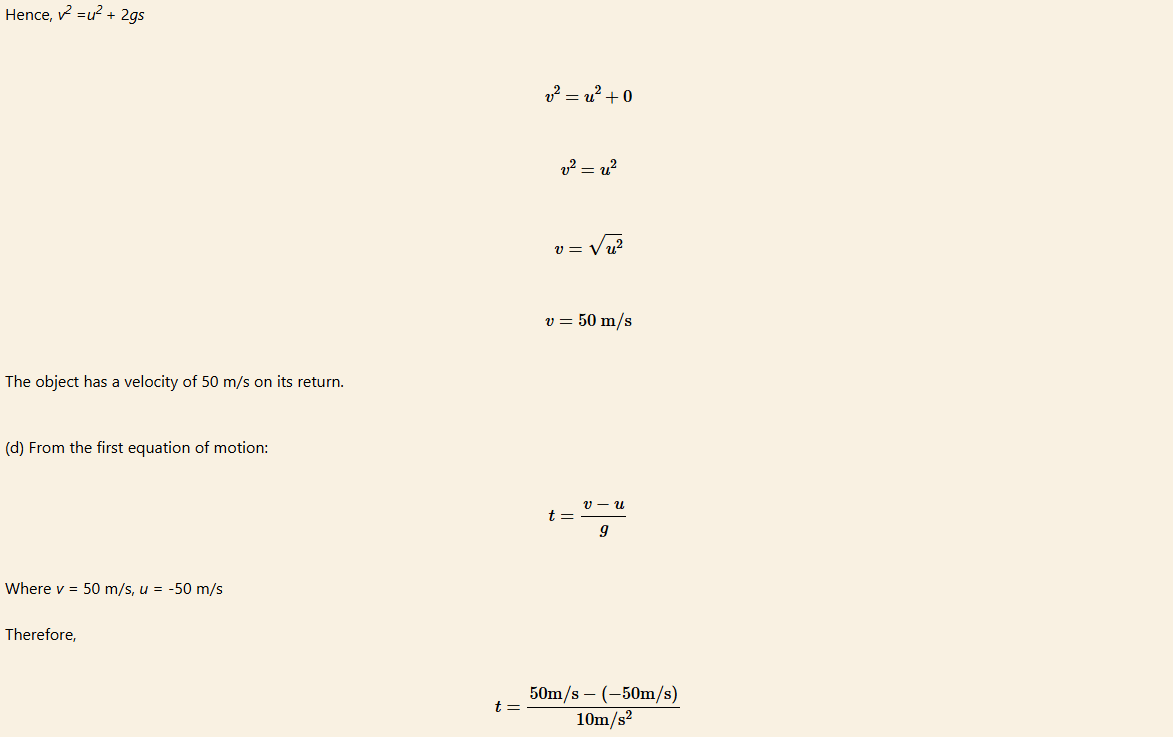
t = 10s
Therefore, the object will take 10 s in the air.
Upon returning to its starting point, the object has the same velocity it started with but in the opposite direction. As expected, the total time in the air is twice the time required to reach the maximum height. The object spends the same time going up as it does when comes back down.
Chapter summary
1. There are several concepts used to describe motion summarised as follows.
(a) Position describes where an object is based on measurements from a chosen reference point.
(b) Distance measures how much the position has changed. It is the length of the path followed by an object. It has magnitude only and is measured in metres.
(c) Displacement measures the net change in position. It is the distance covered by an object in a particular direction, and is also measured in metres.
(d) Average speed measures the rate at which the position changes. This is given by distance divided by time. It is measured in metres per second, m/s.
(e) Average velocity measures the rate of change of displacement, that is, displacement divided by time. It is measured in metres per second, m/s.
(f) Acceleration measures the rate of change of velocity, that is, change in velocity divided by time. It is measured in metres per second squared, m/s2. If acceleration and velocity are in the same direction, the magnitude of velocity will increase. If they are in opposite directions, the magnitude of velocity decreases.
2. Quantities like distance and speed have magnitude only, while displacement, average velocity and acceleration have both magnitude and direction.
3. An object’s motion can be represented by lines and curves on distance-time and velocity-time graphs.
(a) On a distance-time graph the slope of a line represents the object’s speed.
(b) On a velocity–time graph the area under the curve represents the object’s displacement, and the slope of a line represents the object’s acceleration.
4. The relationship between displacement, average velocity and acceleration can be concisely expressed mathematically in equations. These can be manipulated to find new useful relationships called the equations of motion of a uniformly accelerating body.
5. Equations of uniformly accelerated motion are:
v =u + at
s=ut+12at2
v2 =u2 + 2as
6. Motion under the effect of gravity is uniformly accelerated motion. All objects moving up or down have the same acceleration due to gravity. Hence, for a body moving along gravity:
v =u + gt
h=ut+1/2gt2
v2 =u2 + 2gh
and for a body moving against gravity,
v =u – gt
h=ut−1/2gt2
v2 =u2 – 2gh
For a free falling body,
v = gt
h=1/2gt2
v2 = 2gh
Revision Exercise
Section A
1. Choose the most correct answer in items 1-3.
(i) The displacement of an object for a round trip between two locations
(a) is always greater than zero.
(b) is always less than zero.
(c) is zero.
(d) can have any value.
(ii) A car is moving along a straight, level road, with a constant acceleration. Which graph shows the motion of the car?
(iii) A car begins to move. It speeds up until it reaches a constant speed. It continues to travel at this constant speed for the rest of the journey. What happens to the acceleration and what happens to the velocity of the car during the journey?
(a) Both the acceleration and the velocity change.
(b) Only the acceleration changes.
(c) Only the velocity changes.
(d) Neither the acceleration nor the velocity changes.
(iv) The following is the reason why different objects in the air tend to fall at the same time:
(a) They have the same weight.
(b) There is usually no resistance in the air.
(c) Acceleration due to gravity is the same.
(d) They move in the same direction.
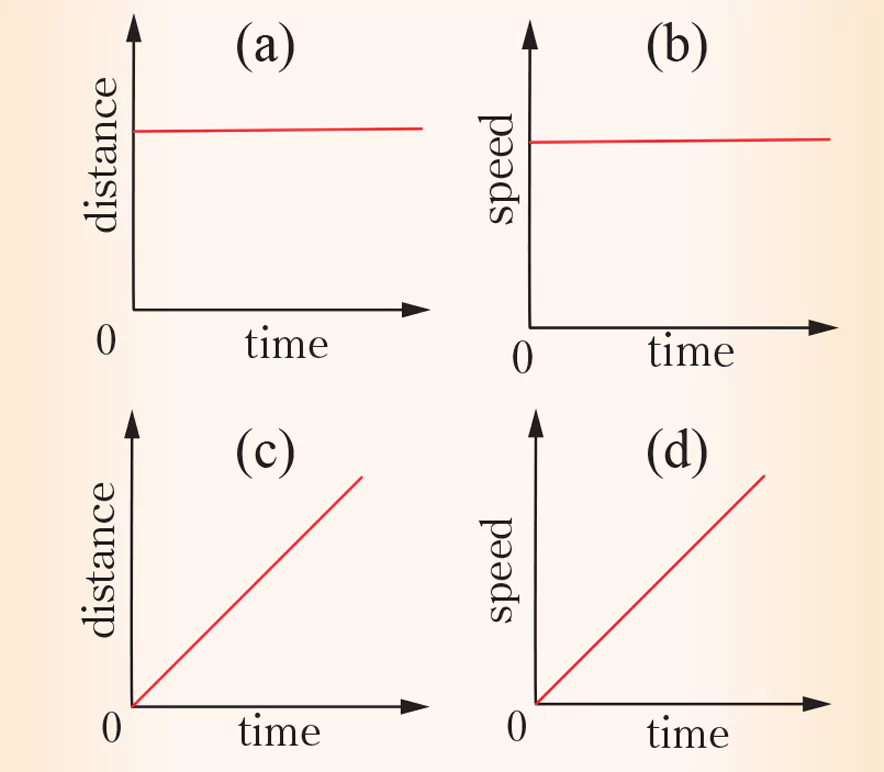
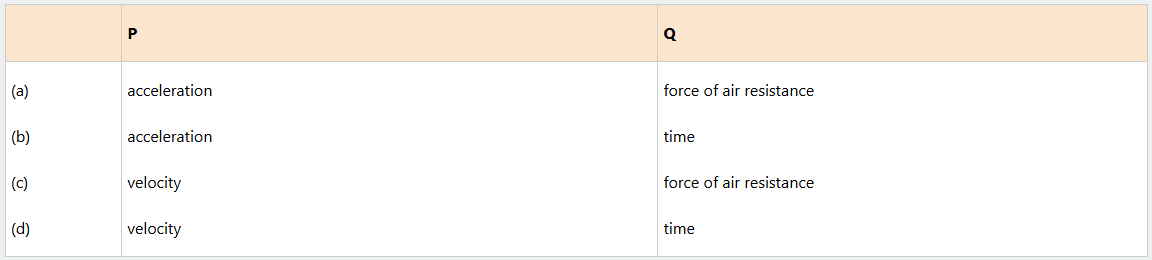
(v) The graph shows how quantity A varies with quantity B for a body projected vertically upwards in a uniform gravitational field with air resistance.

Which pair of quantities could be represented by P and Q?
(vi) A bus was travelling at a speed of 20 m/s. When the bus was 50 m from a traffic light, the light turned red. The bus driver reacted immediately and applied a constant braking force for 5.0 s. The bus decelerated at 4.0 m/s2. Which of the following correctly describes the motion of the bus?
(a) The bus stopped past the traffic light.
(b) The bus stopped at the traffic light.
(c) The bus stopped before the traffic light.
(d) The bus continued to move past the traffic light with decreasing speed.
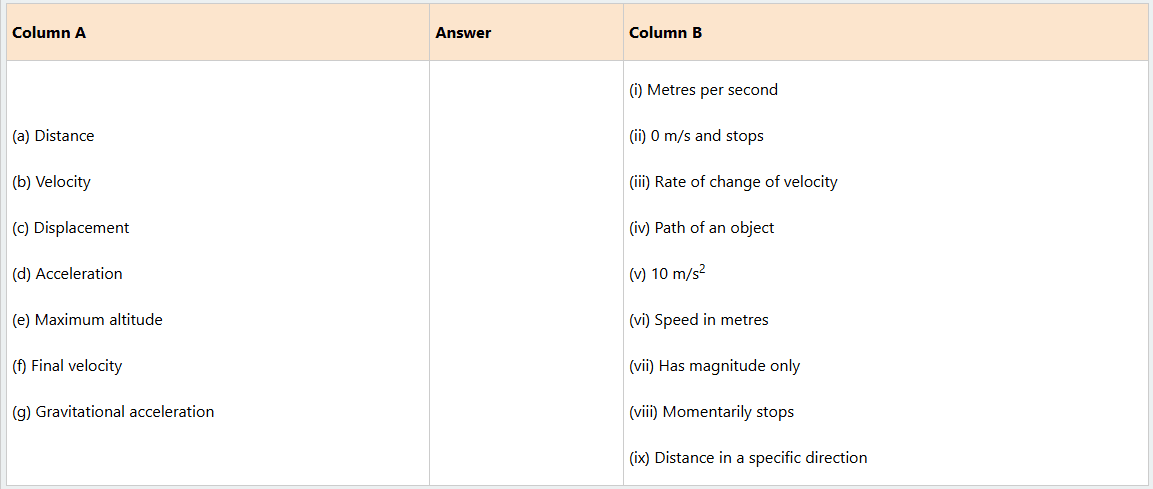
2. Match the items in column A against the corresponding item from column B by writing the correct response in the answer column.
Section B
3. A car begins to move. It speeds up until it reaches a constant speed. It continues to travel at this constant speed for the rest of the journey.
(a) Draw the velocity-time graph to illustrate the motion
(b) What happens to the acceleration and what happens to the velocity of the car during the journey?
(c) A drunkard walking on a narrow path takes 8 steps forward and 6 steps backwards, followed again by 7 steps forward and 5 steps backward, and so on. Each step is 0.8 m long and requires 45 s. Plot the x-t graph of his motion. Determine graphically and otherwise how long the drunkard takes to fall in a pit 13 m away from the start.
4. Model trains move along a track passing through two model stations. Students analyse the motion of a train. They start a digital timer as the train starts to move. They record the time that it enters Station A and the time it enters Station B. Figure 8.31, shows the time on entering Station A and the time on entering Station B.

(a) Calculate the time taken from the train entering Station A to the train entering Station B. State your answer in seconds.
(b) A faster train takes 54 s to travel from Station A to Station B. The distance between the stations is 120 m. Calculate the average speed of this train.
(c) Figure 8.32 shows the velocity-time graph for a train travelling on a different part of the track.

Determine the total distance travelled by the train on this part of the track
5. In a race, cars travelled 200 times around a field track with a length of 1 km.
(a) At the end of the race, what is the distance travelled by the winner?
(b) What is the winner’s displacement?
(c) If the winner completed the race in 3 hours, what is his/her average speed?
(d) What is his/her average velocity?
6. Figure is the displacement–time graph representing the motion of an object.

(a) Using the graph, copy and complete the following table:
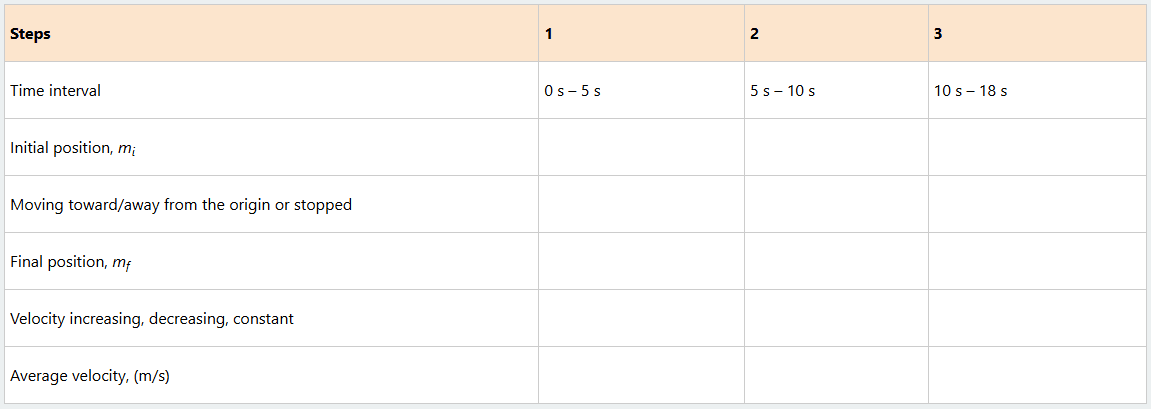
(b) At what time was the object at the origin?
(c) What was the average velocity for the entire motion?
7. (a) Figure below, represents the position-time graph for two students R and S returning from their school located at O to their homes A and B, respectively.
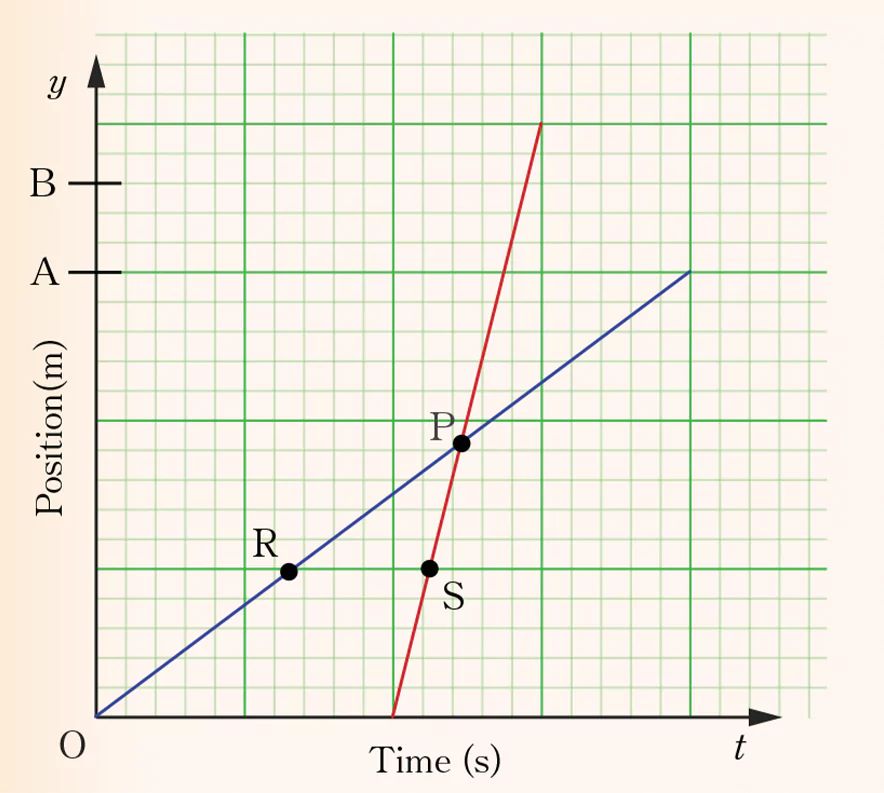
(i) Which one among the students R and S lived closer to school?
(ii) If they were to meet at point P, who would start early for school?
(iii) Who move faster among the two students R and S if they were to reach home at the same time?
(iv) Why at point P student S over take student R?
8. The distance from Kariakoo to Kimara is about 14 km apart. The Rapid Transit Bus (RTB) starts from Kariakoo and comes to rest at Kimara. For three quarter of the distance, the bus is uniformly accelerated and for the remainder distance is uniformly retarded. If it takes 35 minutes over the whole journey.
(a) Draw the velocity-time graph for the whole journey and the corresponding acceleration-time graph.
(b) Find its:
(i) Acceleration;
(ii) Retardation; and
(iii) Maximum speed it attains
9. Figure below, represents a person dropping a ball from the top of the building. After 5 seconds the ball hits the ground.

Calculate:
(a) the height of the building
(b) the velocity of the ball when it hits the ground
10. (a) Form one students were conducting an experiment to investigate the final velocity, distance covered, in every second of a free fall. The results were recorded in the following Table.
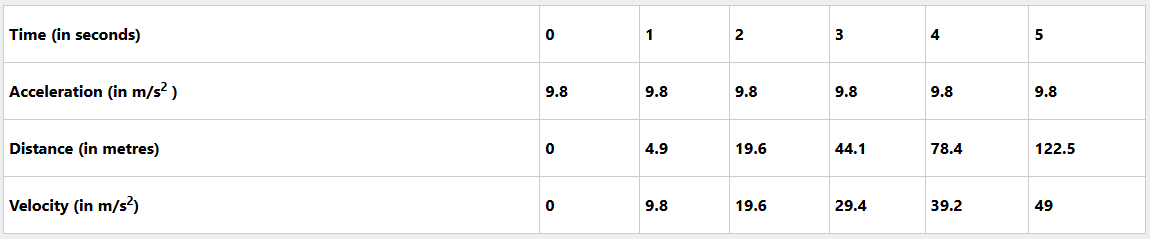
From the table:
(i) What happens when an object undergoes free fall?
(ii) Deduce the relationship between velocity, acceleration due to gravity and time.
(b) If you were to draw the acceleration-time graph, predict the nature of the graph (without drawing the graph).
11. The driver of a bus travelling along a gravel road at a speed of 40 m/s from town A, applies the brake as the bus approaches town B and the bus slows down at a rate of 2 m/s2. If the platform is 400 m long, will the lorry stop in time? Why?
12. A student dropped his ball from a height of 5 meters and then he ran downstairs actually fast to see if he could catch the ball, in doing so he took 1 minute to reach the ground. Will he be able to catch the ball? (note that the air friction is neglected)
13. An object is dropped and is now free-falling under gravity. The stopping distance is given as 0.5 meters for the object. Find out the reaction time neglecting other factors.
14. A car has a velocity of 19m/s and the braking capacity of the car is given as 11m/s2. What will the stopping distance be for the car?
15. At an instant, two cars A and B move at a speed of 15 m/s in the same direction. Car B is 300 m ahead of car A. If car A is accelerating at 6 m/s2 while car B continues to move at the same speed, what will be the time taken by car A to overtake car B?